
NFC East Resource Allocation
Third up in a nine-part series, looking at how the NFC East builds their rosters

This is the third piece in a nine-week project. Each week I take one division, build a single comparable resource value for every player on every projected 53-man roster, and lay out what the numbers describe. So far, the NFC North showed one team, the Vikings, are struggling to keep up with the Joneses. And the NFC South gave us a $267 million superstar gap, and the draft-heaviest team tracked.
This week, the NFC East breaks the pattern. There is no laggard. There is no poor cousin. For the first time, there is a full-on divisional arms race.
The methodology gets a full treatment in the intro piece, but the tl;dr is the same every week. I look at actual cash spending devoted to a roster rather than cap accounting, then layer in draft resource allocation through my own pick valuation chart, which uses the NFL salary cap to assign a financial value to every pick rather than a points system. That creates one currency for cash and draft capital, and it lets us see the whole picture instead of half of it.
The NFC East From 10,000 Feet
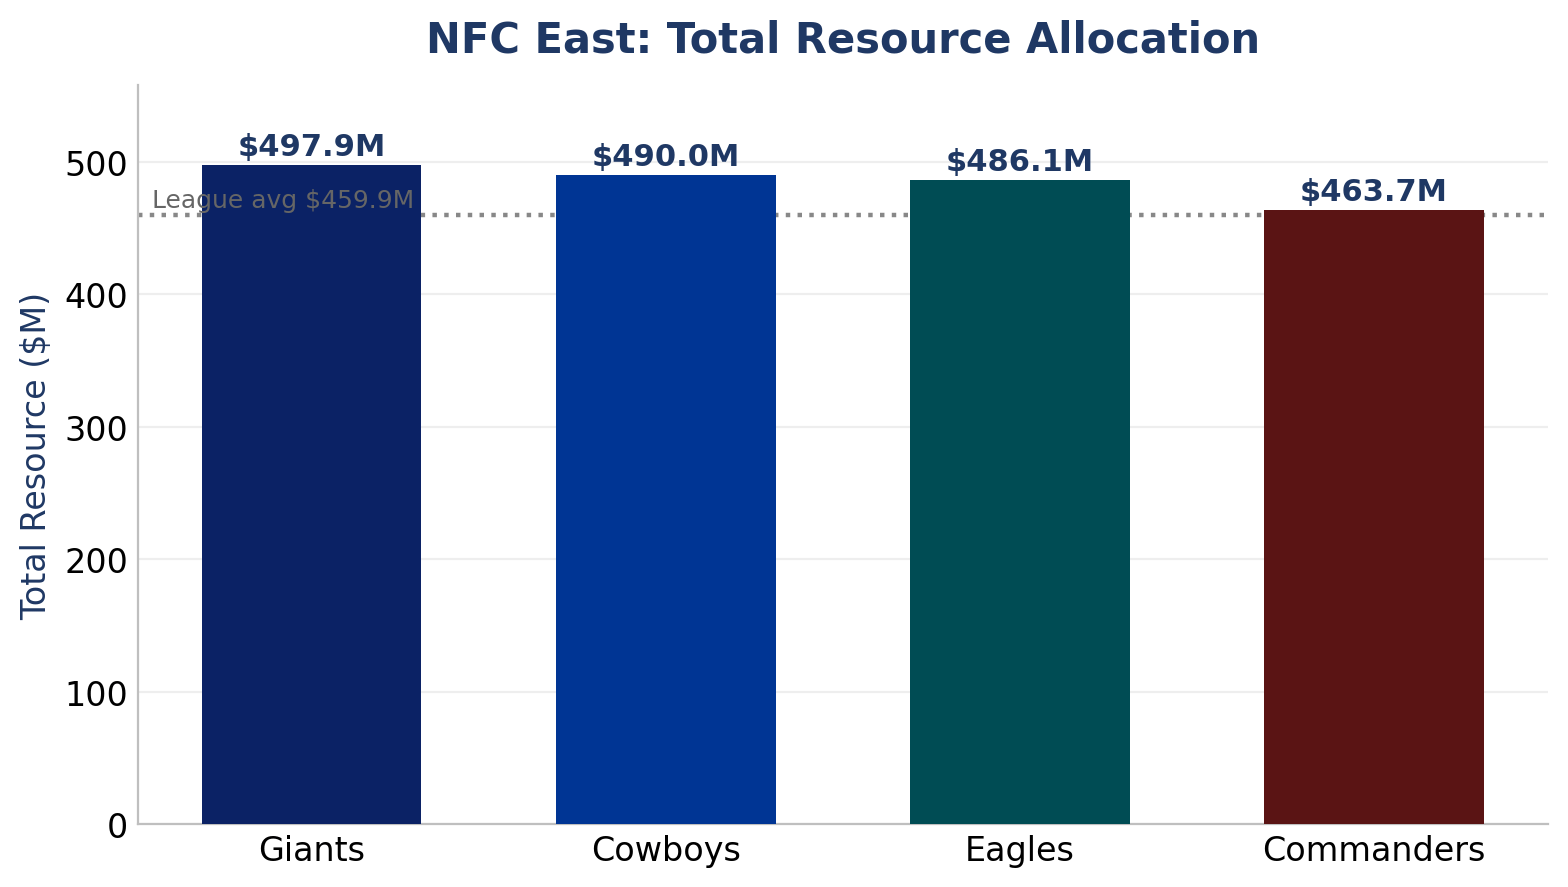
If you are a fan of an NFC East team, you should feel confident your team is piling on the resources to be competitive. Even the Giants, who just reset their coaching staff and traded away their best defensive player, are still hyper-competitive from a roster-resource allocation viewpoint.
The Giants ($497.9M), Cowboys ($490.0M), and Eagles ($486.1M) sit within $12 million of each other. The Commanders ($463.7M) trail the group, but by $22 million, not $100 million like the NFC South and NFC North. This is the tightest division I have tracked so far. And thrillingly, it is a race to the top, not the bottom.
It is also the richest. The four teams combine for $1.94 billion in resources on the field. The North checked in at $1.83 billion. The South at $1.70 billion. The East clears both, and it does it without a single bargain build dragging the average up from below.
The ranks tell the same story. Three of these four teams sit inside the top ten leaguewide in total resource commitment. The Giants are fifth, the Cowboys seventh, the Eagles tenth. Even the Commanders, who sit at the foot of the division in this area, still land above the league average of $459.9 million. Every team in this division is committing resources like a contender. Whether they are built like one is a different question.
“This is the tightest division I have tracked so far. And thrillingly, it is a race to the top, not the bottom.”
Asset Allocation By Type
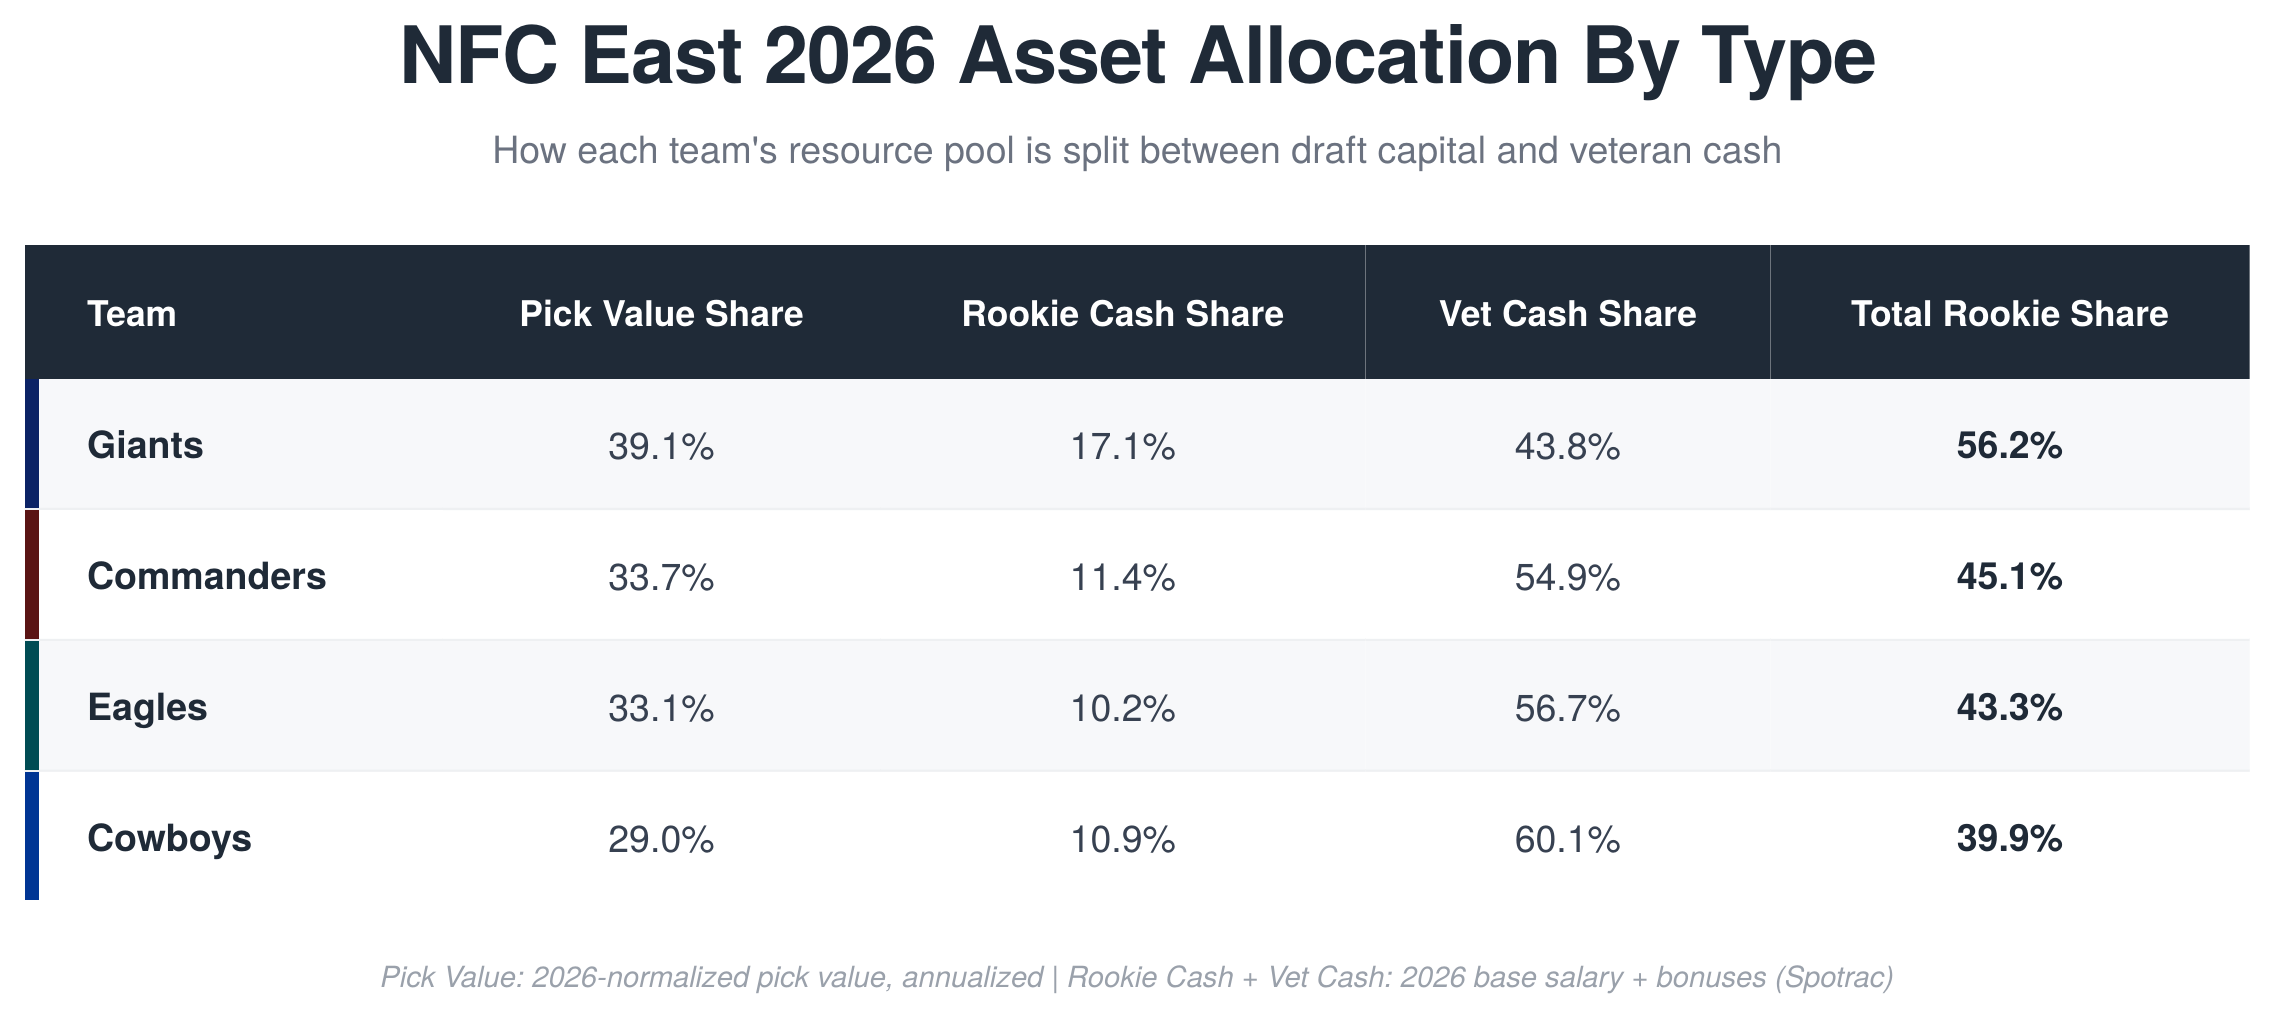
Total spend tells you how much each team is putting on the field. The mix tells you how they got there.
Dallas is the most veteran-built team in the division and across all twelve teams tracked. Of every dollar of resource value on the projected 53, only 29.0 cents corresponds to a rookie’s draft pick. The other 71 cents has already been paid. The Cowboys have made their second-contract decisions. CeeDee Lamb, Dak Prescott, Tyler Smith. This is a roster with its bets already placed.
The Giants are the inverse. At 39.1% rookie share, New York is the draft-heaviest team in the division, and it isn’t close. Rookie deals are set at multiple premium positions including quarterback, edge and wide receiver. The Giants are running the cost-controlled model in a division full of teams that have already paid up.
Philadelphia (33.1%) and Washington (33.7%) sit between the two, nearly identical in mix despite building in completely different directions. The Eagles are mid-stream on a roster they have steadily extended. The Commanders are early on a roster built around a quarterback still on his rookie deal.
What the share does not tell us is whether higher or lower is better. It tells us how much of each roster is still cost-controlled and how much is already spent. A higher share means more second-contract decisions still ahead. Dallas has the fewest of those left. New York has the most. Neither is automatically the right place to be.
Cash vs Draft Capital, Team by Team
The total tells you the commitment. The shape tells you the philosophy. Each team gets two radars on the same scale, one for 2026 cash, one for annualized draft capital. The cash radars look broadly alike across the league, large at the lines and somewhere in the secondary. The draft radars are where front offices diverge.
Dallas Cowboys
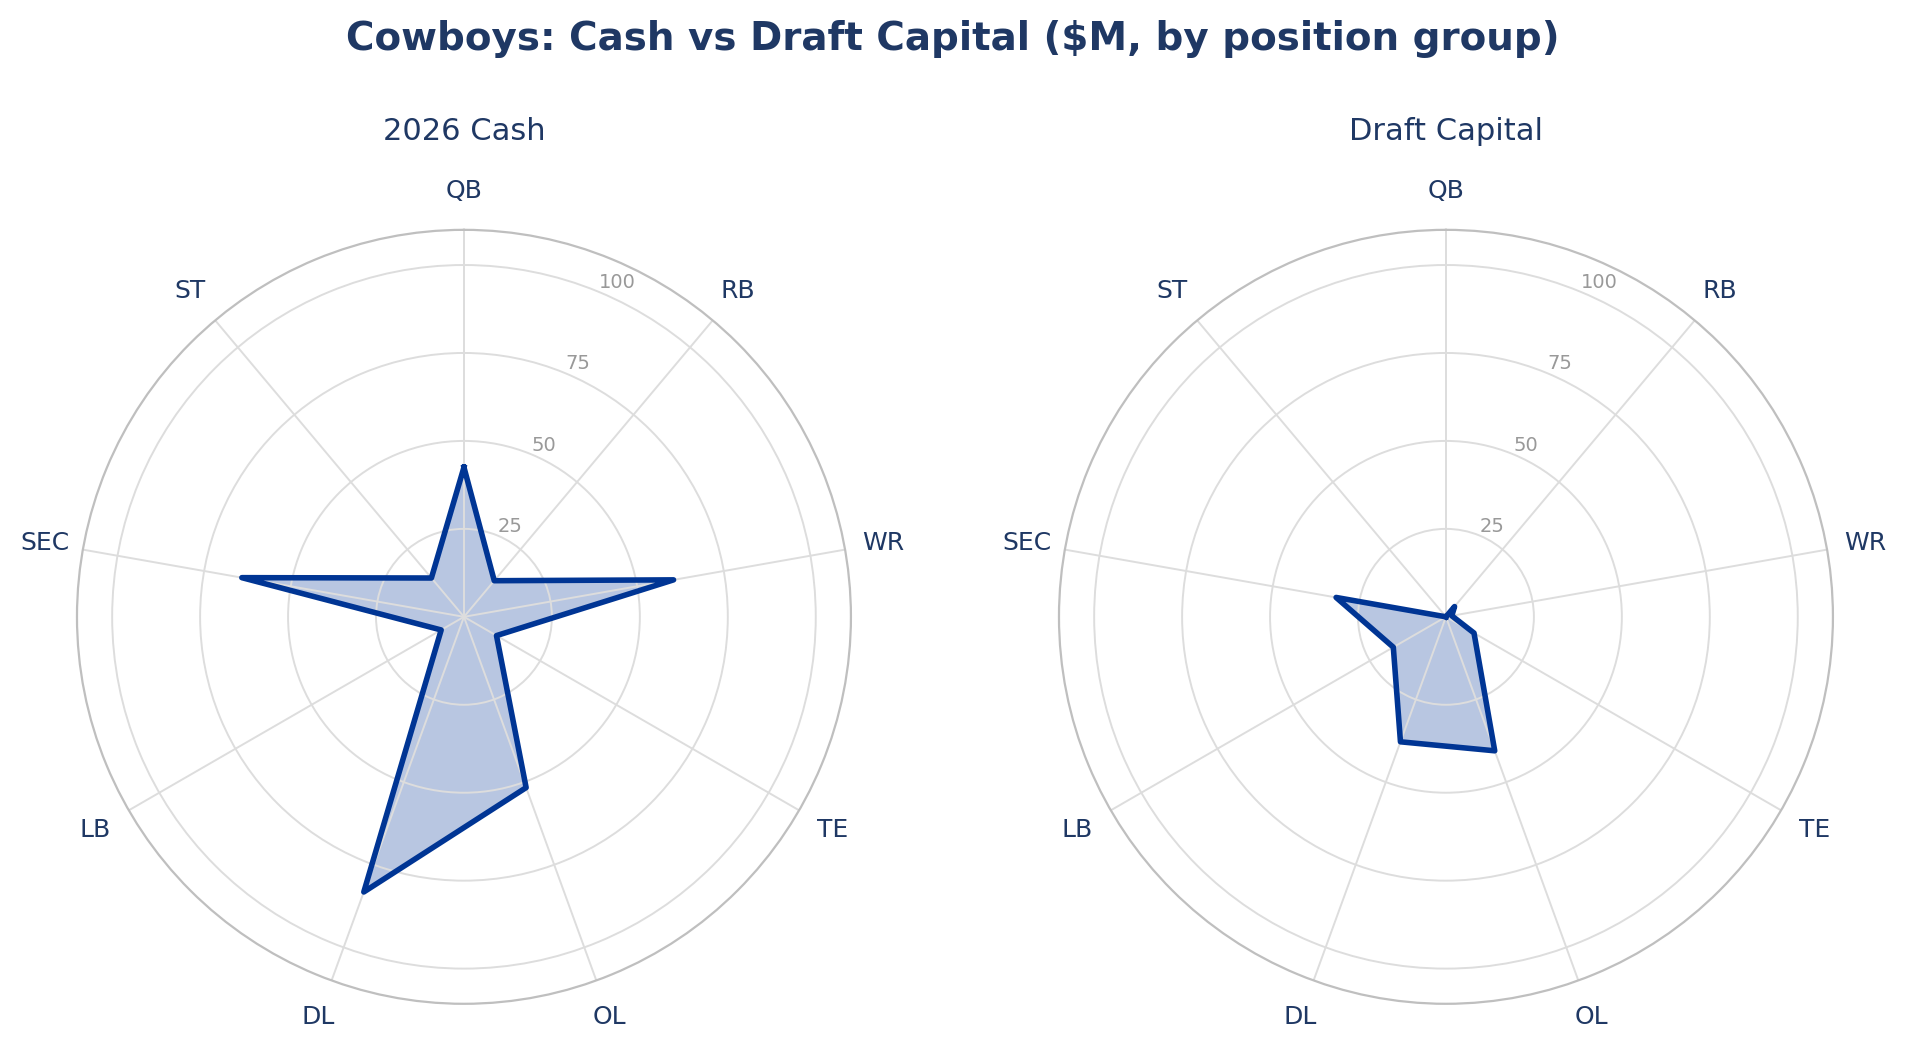
From a modern team-building perspective, the Cowboys are spending money everywhere they should. For a team that is often classified as run from Jerry Jones’ hip, they apply a surprisingly analytical approach. Both offensive and defensive lines, receiver, quarterback and the secondary all receive high cash investments. Their draft capital has been focused on fixing a defense that has struggled to meet the impressive offense they have built.
New York Giants
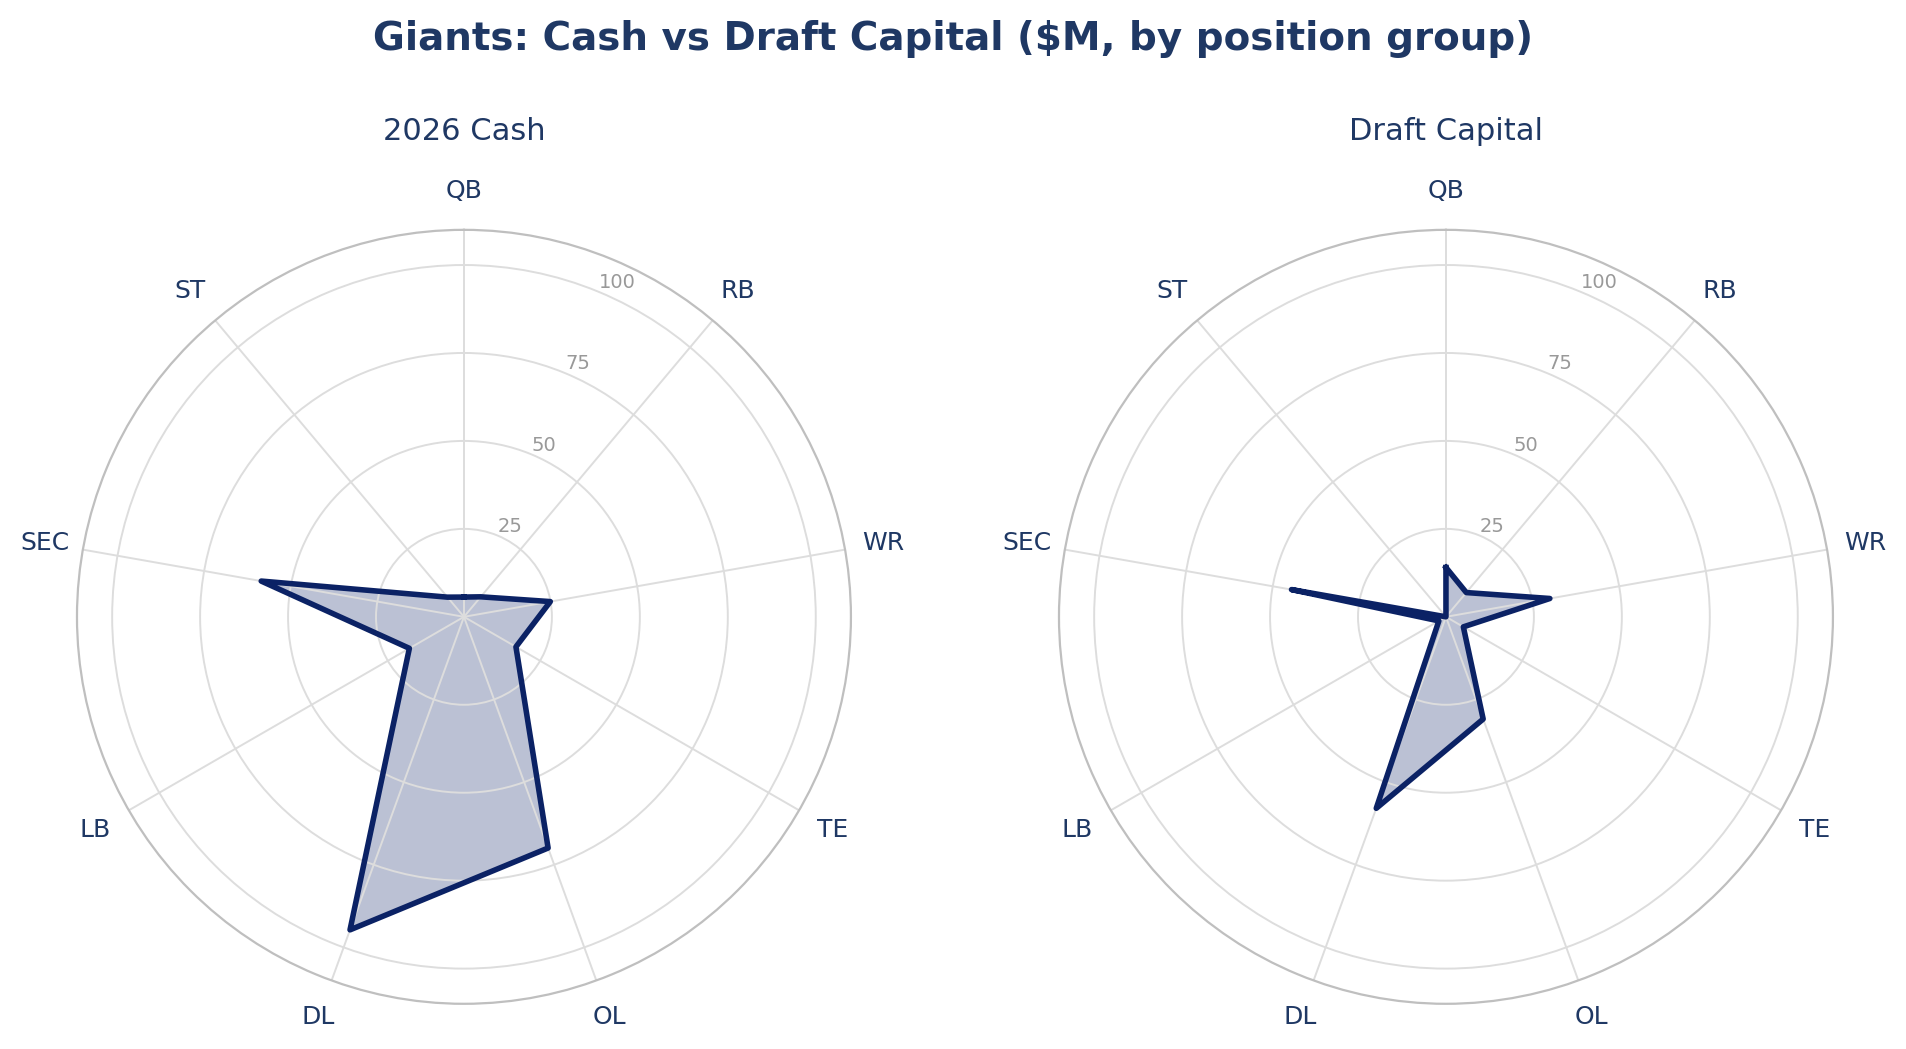
While Jaxson Dart is a first-round asset, getting him at the back of the first round represents a much smaller total investment than most other teams have put into their quarterback rooms.
The Giants approach to building their team is using those savings at quarterback to invest in the defense. The team has sunk considerable cash and draft resources into both the secondary and pass rush. The offensive line is a secondary investment avenue for both allocation types as well.
Philadelphia Eagles
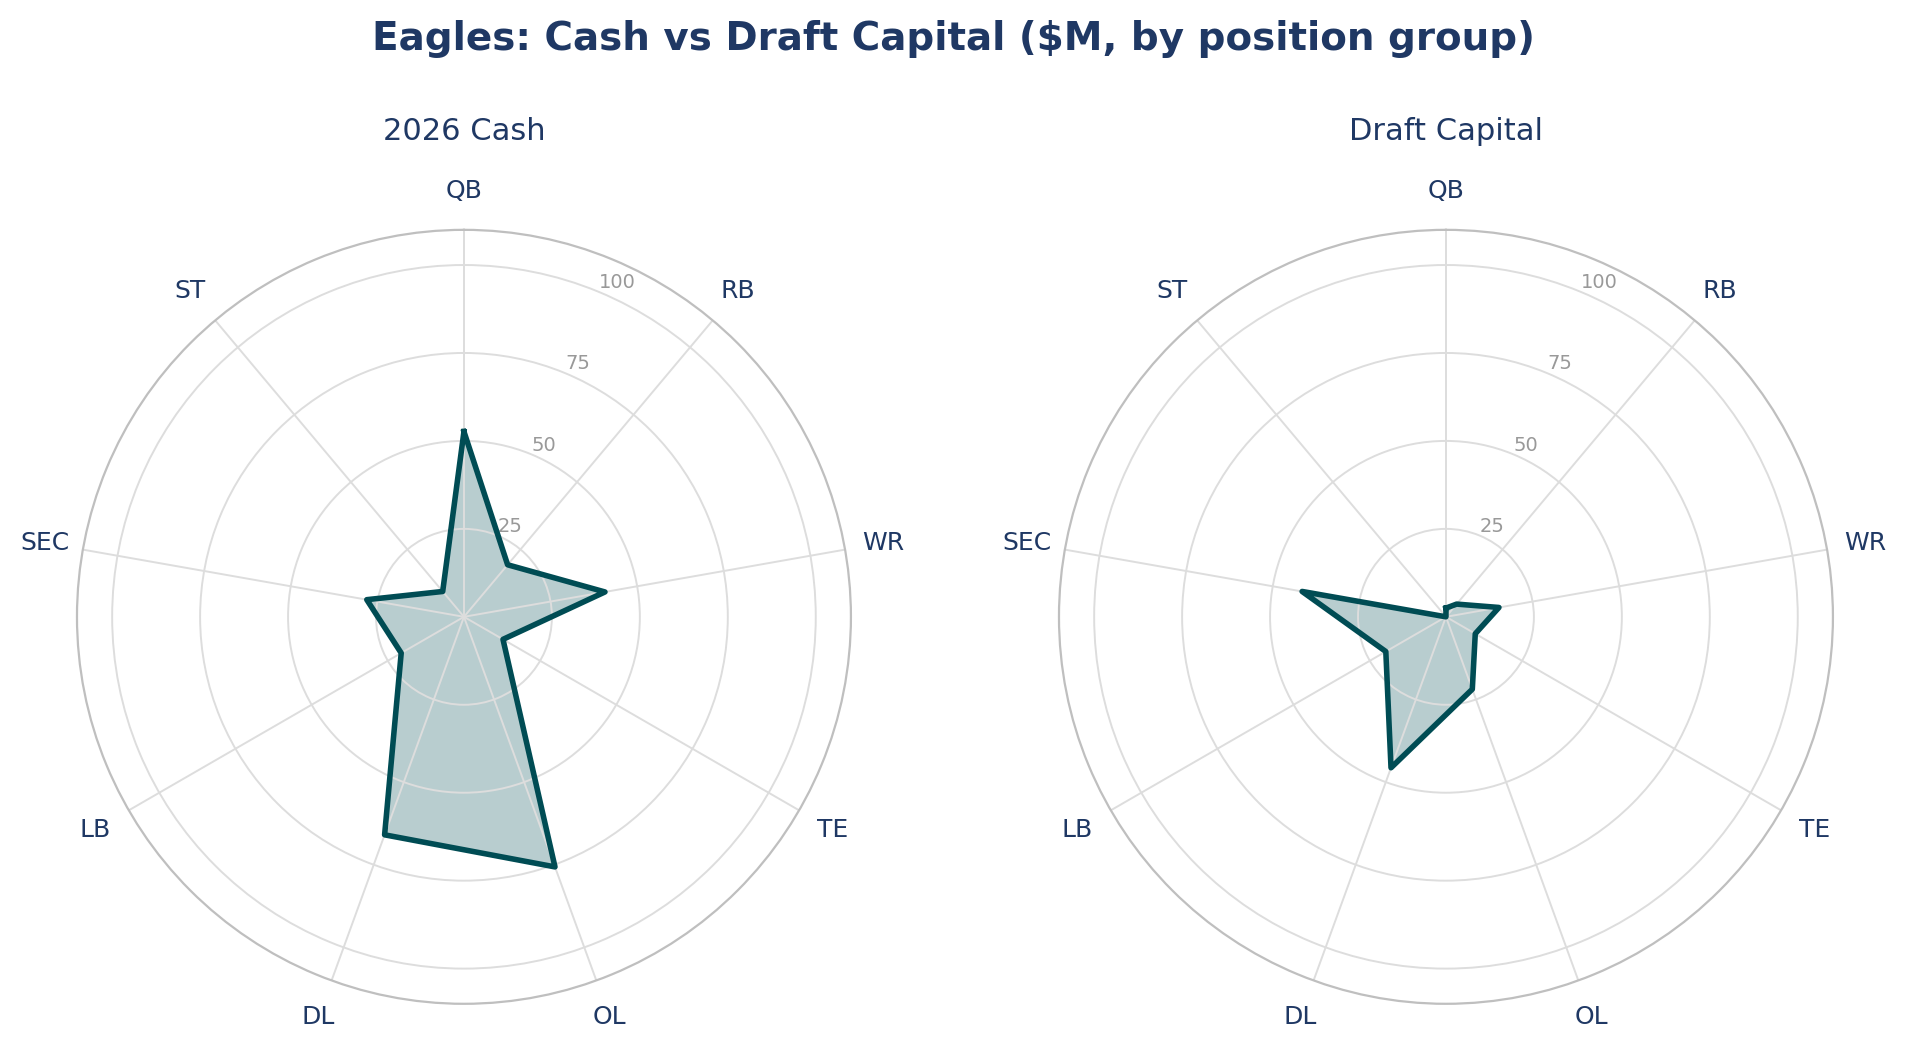
The Eagles’ cash is a more balanced approach to roster building. Between Zack Baun and Saquon Barkley, they are not afraid to devote significant veteran contracts to positions typically seen as lower value. But they still place a high priority on offensive line, quarterback and receiver. Philadelphia is taking full advantage of their double draft hit of Quinyon Mitchell and Cooper DeJean, by spending less cash on that area of the roster.
But both charts show there is a philosophical throughline that the Eagles never stray from. It is that the pass rush is their gravitational center.
They continually invest, through all resource types, in the defensive line. They shelled out a large contract for Jordan Davis, have significant draft resources tied up in Nolan Smith and Jalen Carter, and just traded for Jonathan Greenard. And a second contract may be coming soon for Moro Ojomo.
“But both charts show there is a philosophical throughline that the Eagles never stray from. It is that the pass rush is their gravitational center.”
Washington Commanders
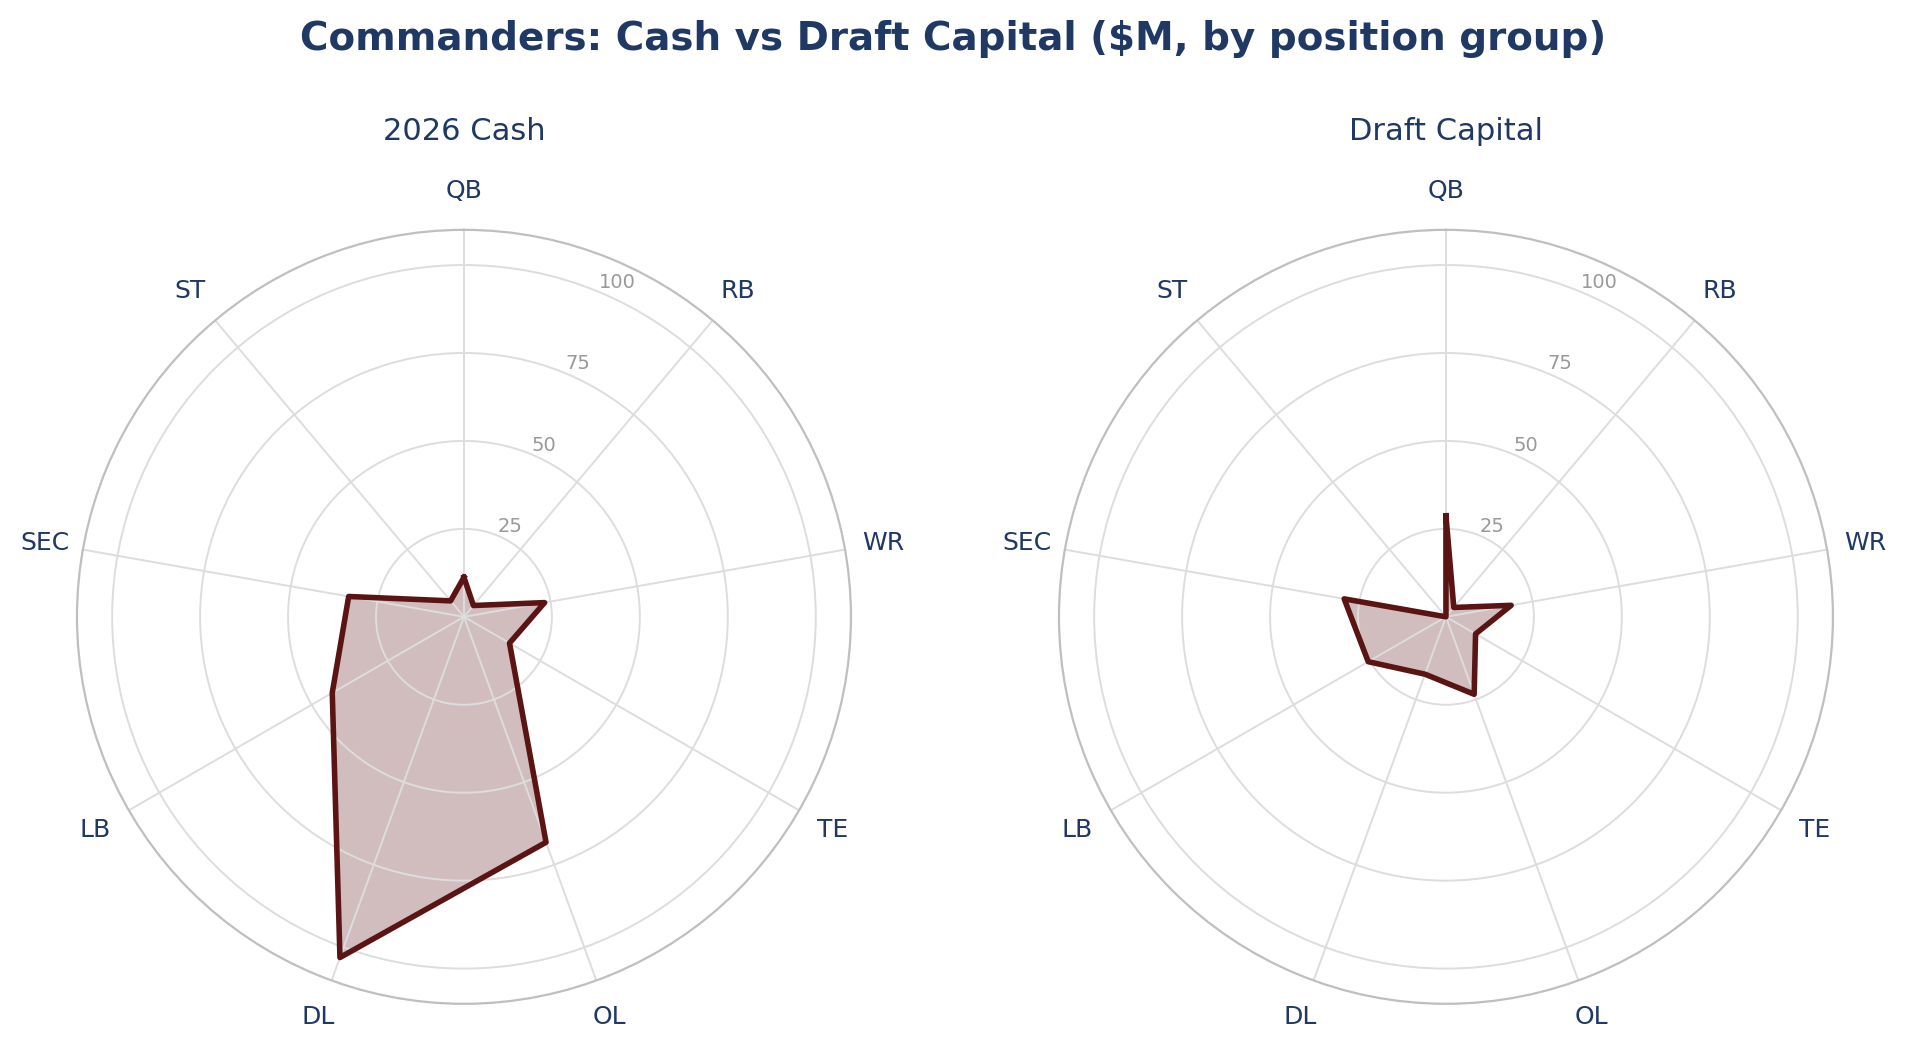
Two years ago, the Commanders hit on quarterback Jayden Daniels with the second overall pick in the draft. Since then, general manager Adam Peters has been sinking real resources into questionable investments trying to build around his star quarterback. The result is a roster that competes with the rest of the division on paper but may not hold up as well on the field.
Huge cash resources have been dedicated to both the offensive and defensive lines. They have tried to tie the defense together with moderate-to-strong investments in both draft capital and cash in the secondary.
Where the Money Actually Goes
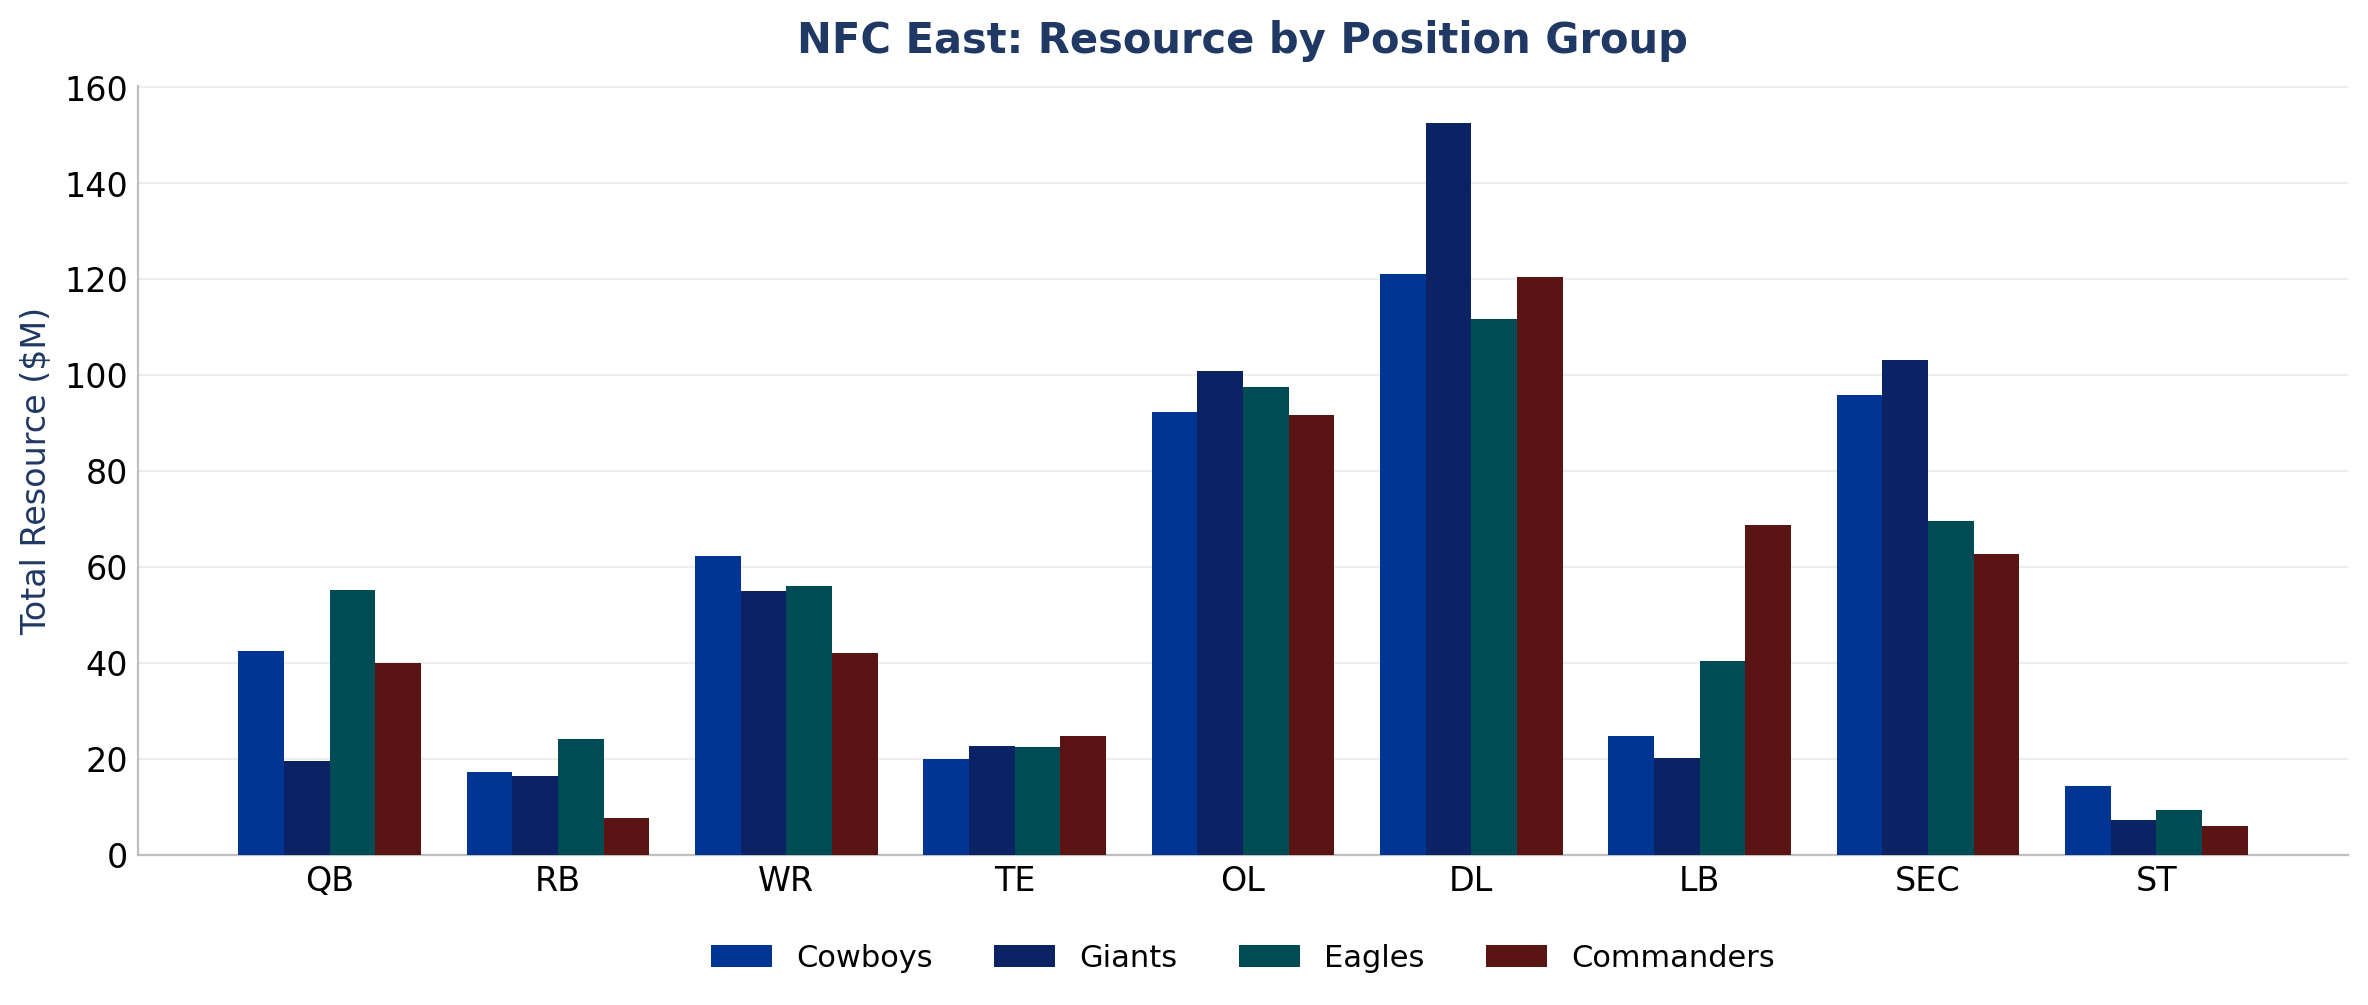
Set the teams against each other by position group and the order is familiar. Defensive line first, offensive line second, secondary third, for all four teams. That order is mostly a function of group size. The deviations sit further down, and that is where the front offices show their hand.
The headline before we get to the groups: this is the trench division. All four offensive lines clear $91 million. All four defensive lines clear $111 million. In the NFC North, three of four offensive lines sat between $75 and $89 million. The East’s floor is the North’s ceiling. Whatever else these front offices disagree on, they agree on what it costs to build in the trenches, and the number is high.
Quarterback
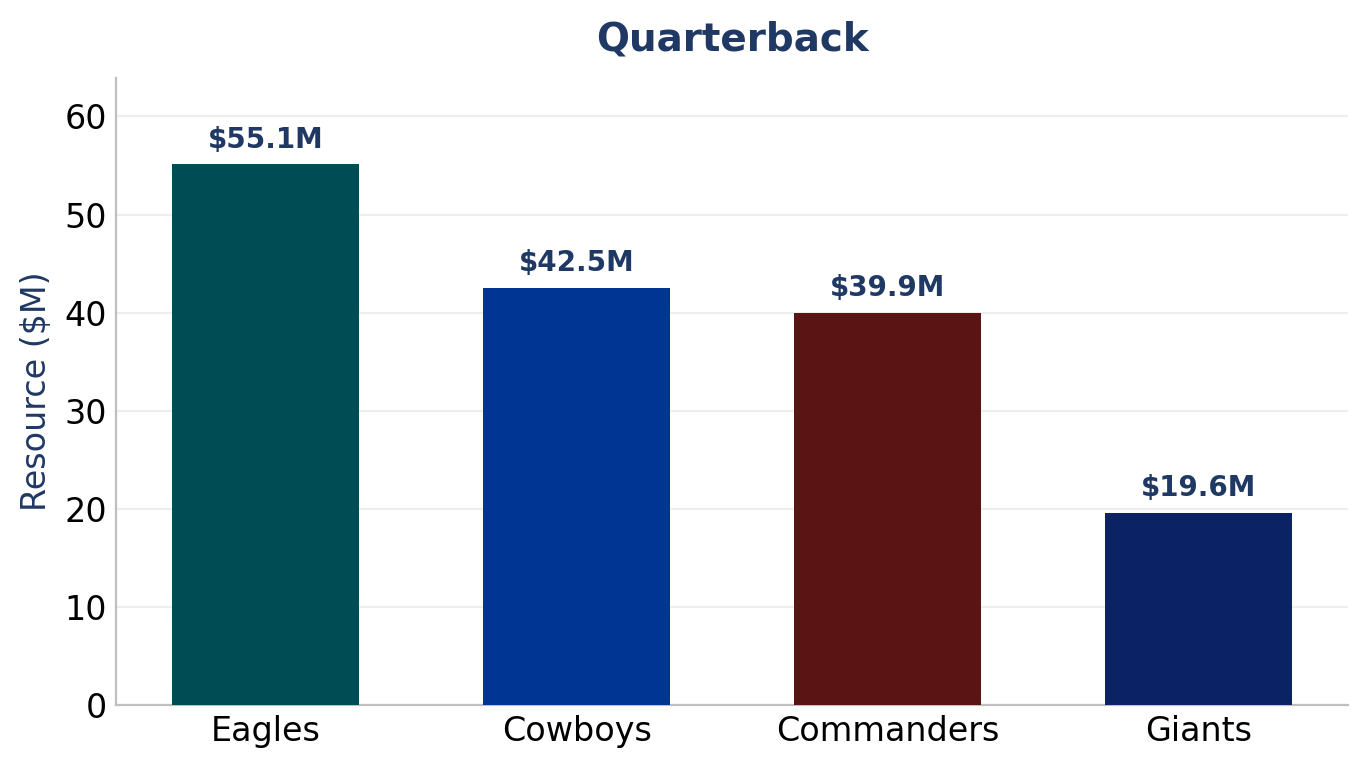
Four quarterbacks, four different points on the cost curve.
Philadelphia ($55.1M) is the most expensive room, paying full freight on Jalen Hurts at $51.5M cash. The Eagles are paying market rate for a quarterback who has already won them a title. No complaints attached.
Dallas ($42.5M) sits second on Dak Prescott’s $40M. Another full-freight veteran deal, another quarterback the team has decided to pay rather than replace. Prescott is worth a bit more of a detailed evaluation though. His contract gets all of the headlines. At $60 million per year, he is the highest paid quarterback in the league on an APY basis. But after a large upfront payment in 2024, the cash payments since are more reasonable than anything. The $40 million he is earning this year is tied for 10th at the position with Baker Mayfield and Matthew Stafford.
Washington ($39.9M) is where the framework turns. Jayden Daniels carries $28.7M of pick value as the #2 overall selection in 2024, against $4.2M of actual cash. That $24.5 million gap is the structural advantage Washington is operating with. Drafting Daniels cost the Commanders roughly what a mid-tier veteran would have, except Daniels is not mid-tier. He is the reason this roster gets to spend $103 million on the defensive line in cash. The Caleb Williams math from week one, except Washington has devoted an extra $40 million to the roster to take advantage of their cost-controlled QB.
New York ($19.6M) runs the cheapest room in the division and one of the cheapest in football. Jaxson Dart’s pick value is $14.0M as the #25 selection in 2025, against $1.6M cash, with Jameis Winston at $4M behind him. Pick value falls steeply outside the top ten, so Dart’s capital does not carry the weight Daniels’s does. But the cash advantage is identical. The Giants are buying a defense with the money they are not spending at quarterback.
“The Caleb Williams math from week one, except Washington has devoted an extra $40 million to the roster to take advantage of their cost controlled-qb.”
Running Back
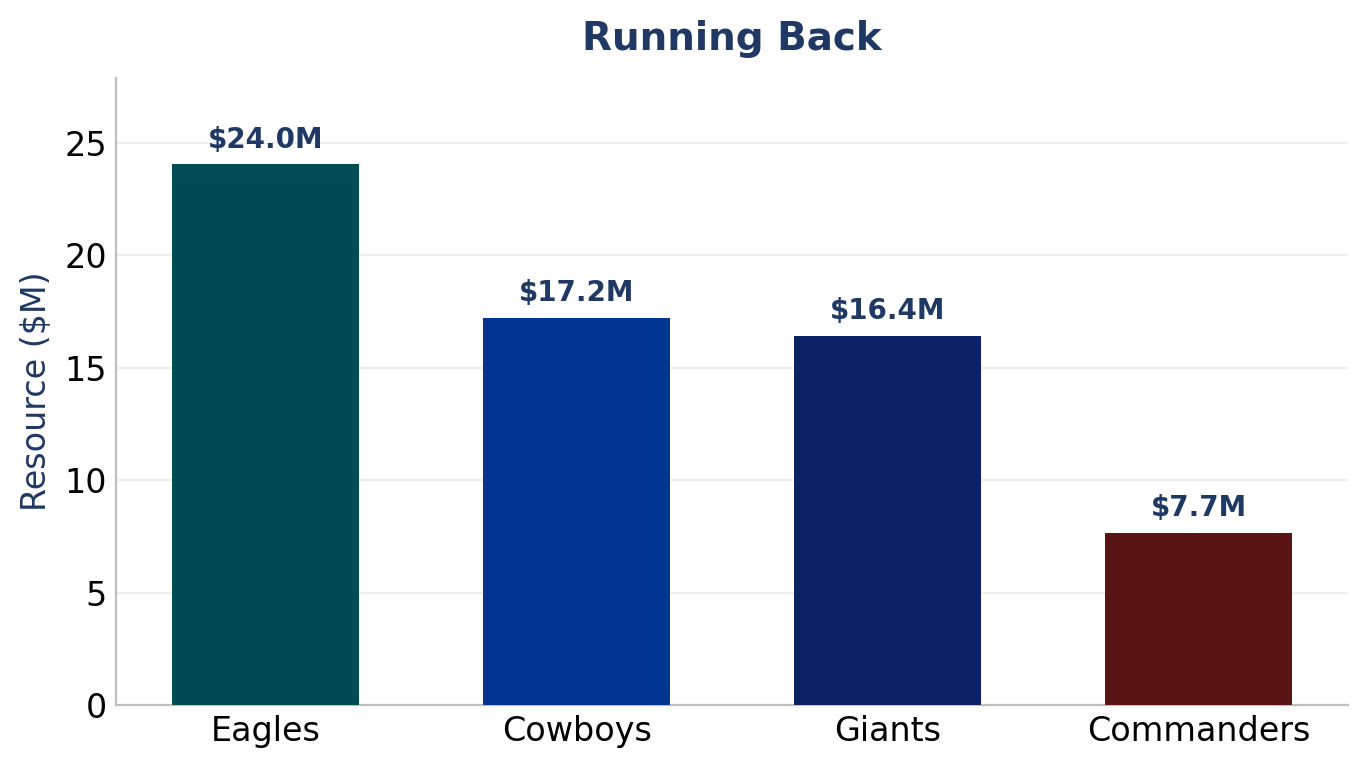
Philadelphia ($24.0M) leads, almost entirely on Saquon Barkley’s $16.8M. The Eagles are the one team in the division paying a back top-end money, and they have a Super Bowl run to justify it.
Dallas ($17.2M) and New York ($16.4M) land in the middle, and they get there the same way, a veteran back plus a true fullback. Javonte Williams and Hunter Luepke in Dallas, the rookie-capital pair of Cam Skattebo and Tyrone Tracy Jr. plus Patrick Ricard in New York. Two of the four NFC East teams still roster a fullback, which is two more than most divisions can say.
Washington ($7.7M) is the lowest running back investment in the division and the lowest across all twelve teams tracked. Kaytron Allen, Rachaad White, and Jacory Croskey-Merritt make up a backfield assembled almost entirely from late-round picks and minimum deals. The Commanders are going cheap at running back because they know their offensive line and quarterback should bolster the run game enough to devote resources elsewhere.
Wide Receiver
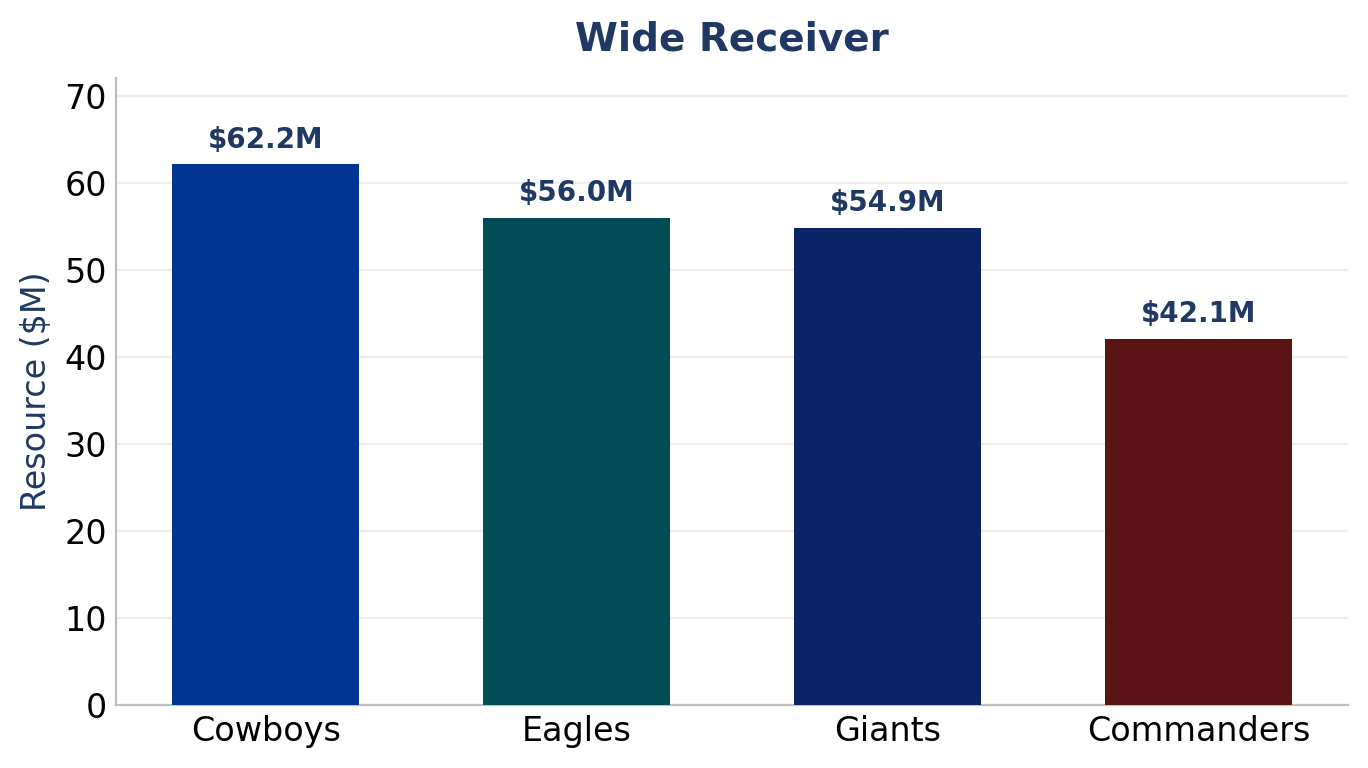
Dallas ($62.2M) leads the division and tops all twelve teams to this point. George Pickens at $27.3M, acquired by trade, plus CeeDee Lamb at $26.0M is the only pairing in the division with two receivers north of $26 million. The Cowboys committed to a two-headed room and are paying cash for both heads.
Philadelphia ($56.0M) builds it differently, with Makai Lemon’s rookie pick value ($15.3M as a 2026 first round pick plus his large signing bonus) layered on top of DeVonta Smith at $14M. New York ($54.9M) is Malik Nabers’s $22.2M pick value as the #6 pick in 2024 plus Darius Slayton’s $13M veteran deal.
Washington ($42.1M) is the lowest in the division. Terry McLaurin’s $14.2M anchors a room that otherwise runs on rookie capital, Antonio Williams, Luke McCaffrey, and Jaylin Lane. The Commanders have a WR1 and a stack of cheap lottery tickets behind him.
An interesting structural note is playing out for two of these teams. Both Terry McLaurin and DeVonta Smith are secured through contracts at much higher APY’s than their 2026 cash payments would have you believe. McLaurin’s is a function of a large signing bonus and a back ended cash structure. Smith is still one year away from his larger cash payouts.
The cash payment structure of veteran deals is a real advantage some teams consciously take advantage of when taking advantage of their year-to-year cash budgets. The Eagles are one of those teams.
Tight End
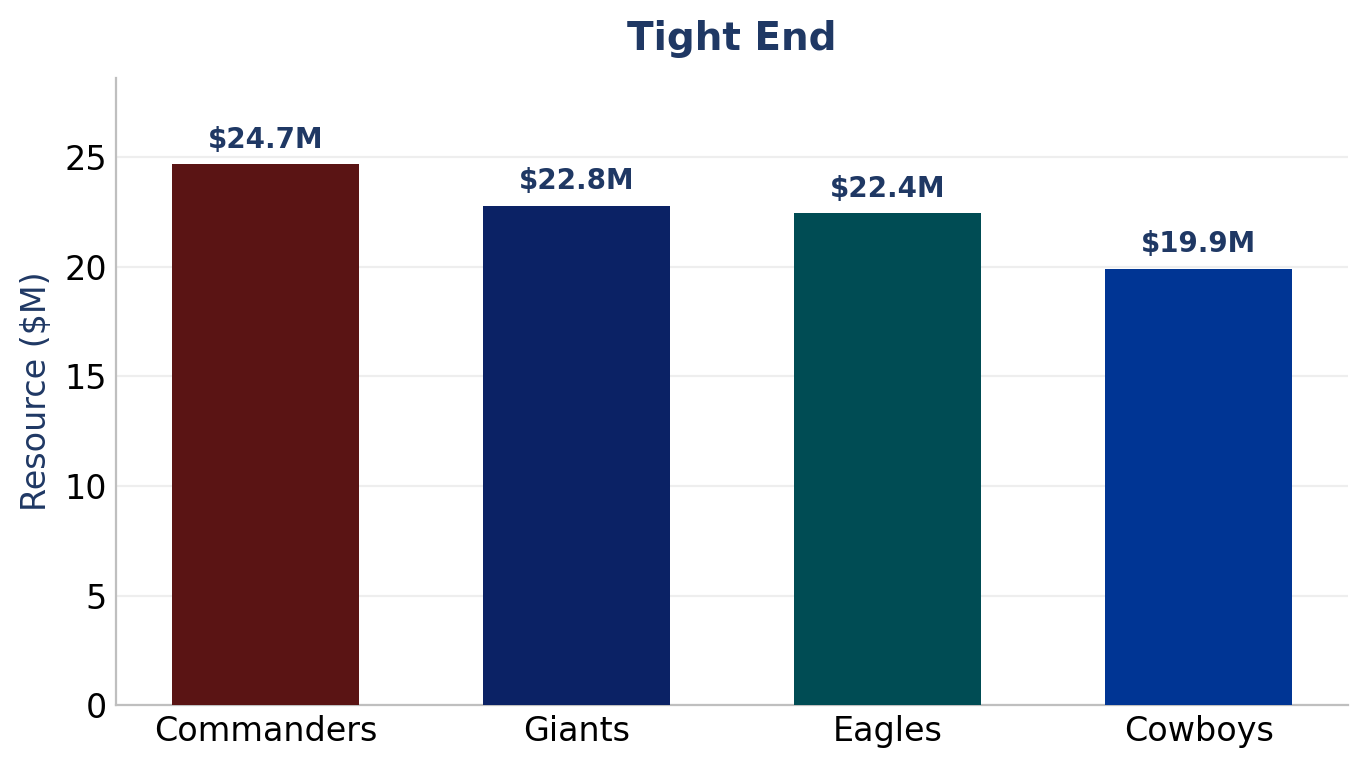
For two straight weeks, Chicago’s $40M tight end room was the outlier in the data. This week the NFC East offers the opposite, the most uniform tight end spending of any division tracked. All four teams sit between $19.9M and $24.7M.
Washington ($24.7M) leads on Ben Sinnott’s pick value plus Chig Okonkwo at $10M. New York ($22.8M) runs through Isaiah Likely’s $14.5M. Philadelphia ($22.4M) pairs Eli Stowers’s rookie capital with Dallas Goedert. Dallas ($19.9M) has Luke Schoonmaker’s pick value and Jake Ferguson at $8M.
No team in this division is making tight end a strategic bet, and no team is ignoring it either. After three divisional profiles, Chicago remains the only team treating the position as a real resource priority. The league has not followed.
Offensive Line
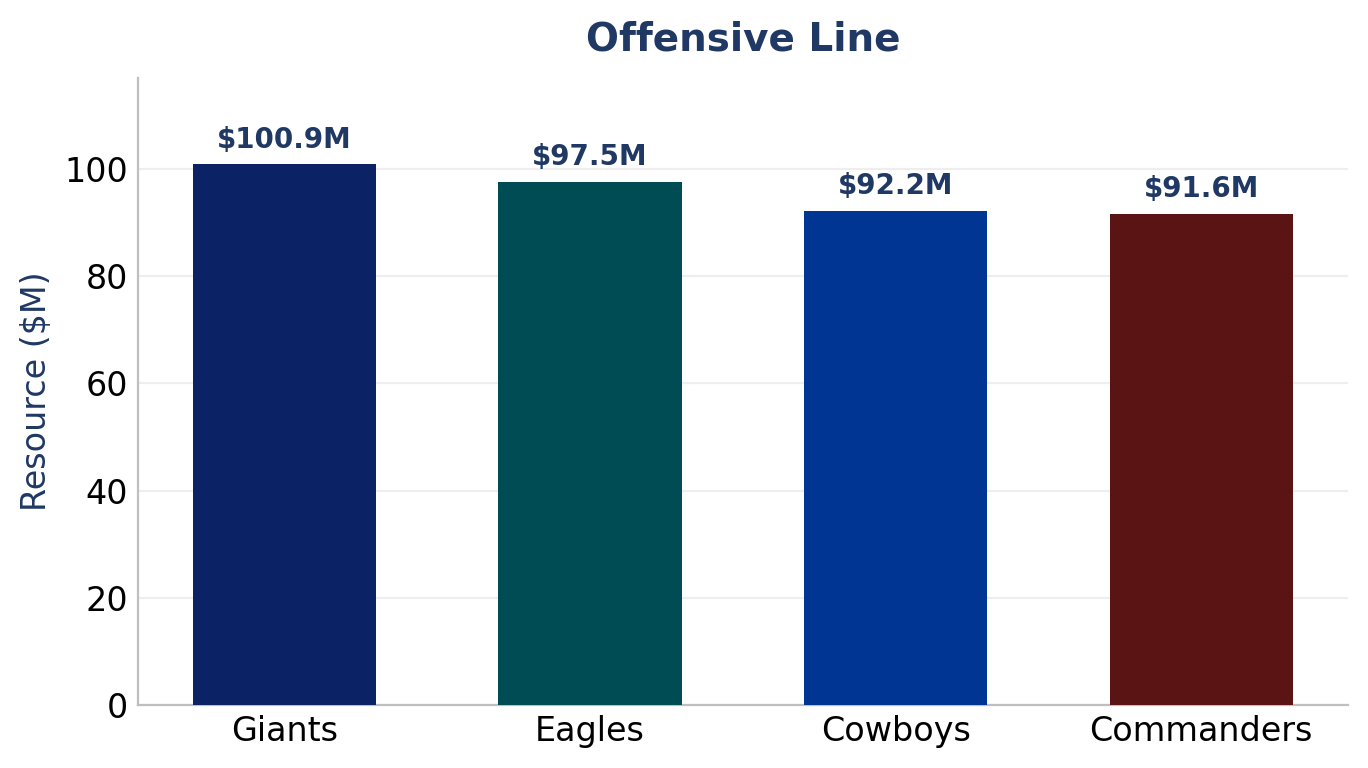
Here is the trench division in one chart. All four offensive lines sit between $91.6M and $100.9M. A $9.3M band, with every one of them above $91 million. The North’s tightest-grouped position topped out at $89M. The East’s lowest starts higher than that.
New York ($100.9M) leads, with Francis Mauigoa’s rookie pick value ($39.1M as a 2026 first), stacked on Andrew Thomas at $17.4M and veterans Jermaine Eluemunor and John Michael Schmitz Jr. Philadelphia ($97.5M) runs the famous unit, Lane Johnson, Landon Dickerson, Jordan Mailata, Cam Jurgens, almost all veteran cash on players the Eagles drafted and kept. Dallas ($92.2M) leans on its Tylers (Guyton, Booker and Smith). Washington ($91.6M) anchors with Laremy Tunsil’s $34.4M acquired by trade, plus Sam Cosmi and rookie Josh Conerly Jr.
The takeaway is that all four teams are committing at the highest level to protecting their quarterbacks and establishing their run games. Four front offices with four philosophies all landed within $9 million of each other on what a starting offensive line should cost, and that number is north of $90 million. This is the clearest convergence in the division.
Defensive Line
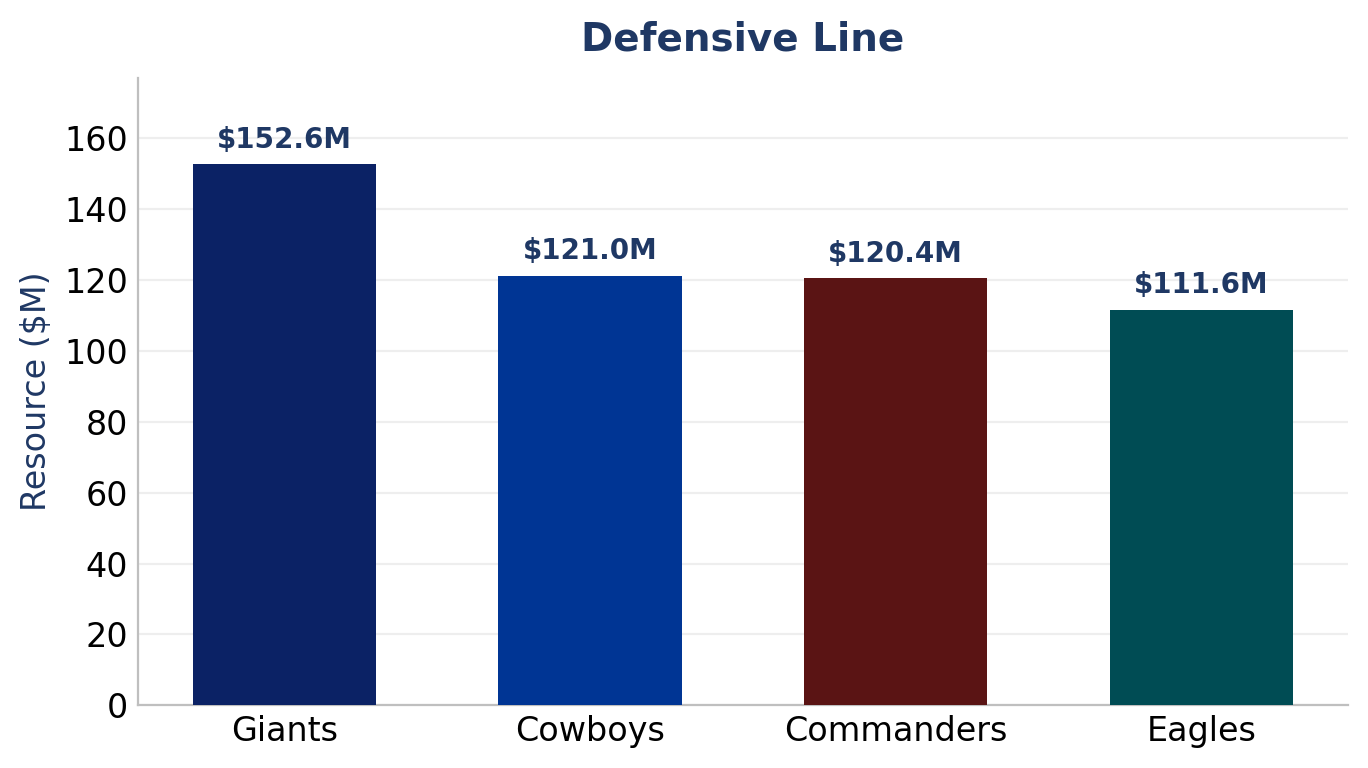
The largest investment for every team in the division, every year, in every division. But the NFC East takes it further than anyone. Three of these four defensive lines clear $120 million. Across the previous two divisions, only Green Bay and Carolina cleared $115 million combined. The East has three teams past that mark in one division.
New York ($152.6M) is the highest defensive line figure across all twelve teams tracked. Arvell Reese’s rookie capital ($55.4M as a 2026 first round pick plus his large year-one cash payment) sits on top of Abdul Carter ($29.0M, $26.1M of it pick value as the #3 pick in 2025), Brian Burns at $25.6M, and Kayvon Thibodeaux at $14.8M. That is a four-man edge rotation carrying resources most teams spend on an entire front seven. Add Darius Alexander and DJ Reader on the interior and the Giants have built the most expensive defensive line I have found so far.
Dallas ($121.0M) pairs two trade-acquired interior veterans, Quinnen Williams ($21.8M) and Kenny Clark ($21.5M), with Malachi Lawrence’s rookie capital and Rashan Gary at $16M. Washington ($120.4M) does it almost entirely in cash, $103.1M of the $120.4M, with Odafe Oweh at $30M, Daron Payne at $22.4M, and Javon Kinlaw added in free agency. The Commanders bought their front rather than drafting it.
Philadelphia ($111.6M) is the lowest of the group in resources committed, but hardly the least talented. This signals the Eagles’ real competitive edge over the past several years, which is ROI. Jalen Carter ($23.6M, $19.9M of it pick value), Nolan Smith ($15.4M), and Jordan Davis ($20.5M) are three first-round defensive linemen, two of them still on rookie capital, with Jonathan Greenard’s $25.2M veteran deal on the edge. This is the build everyone is chasing, premium picks on the line played before the second contract arrives.
Linebacker
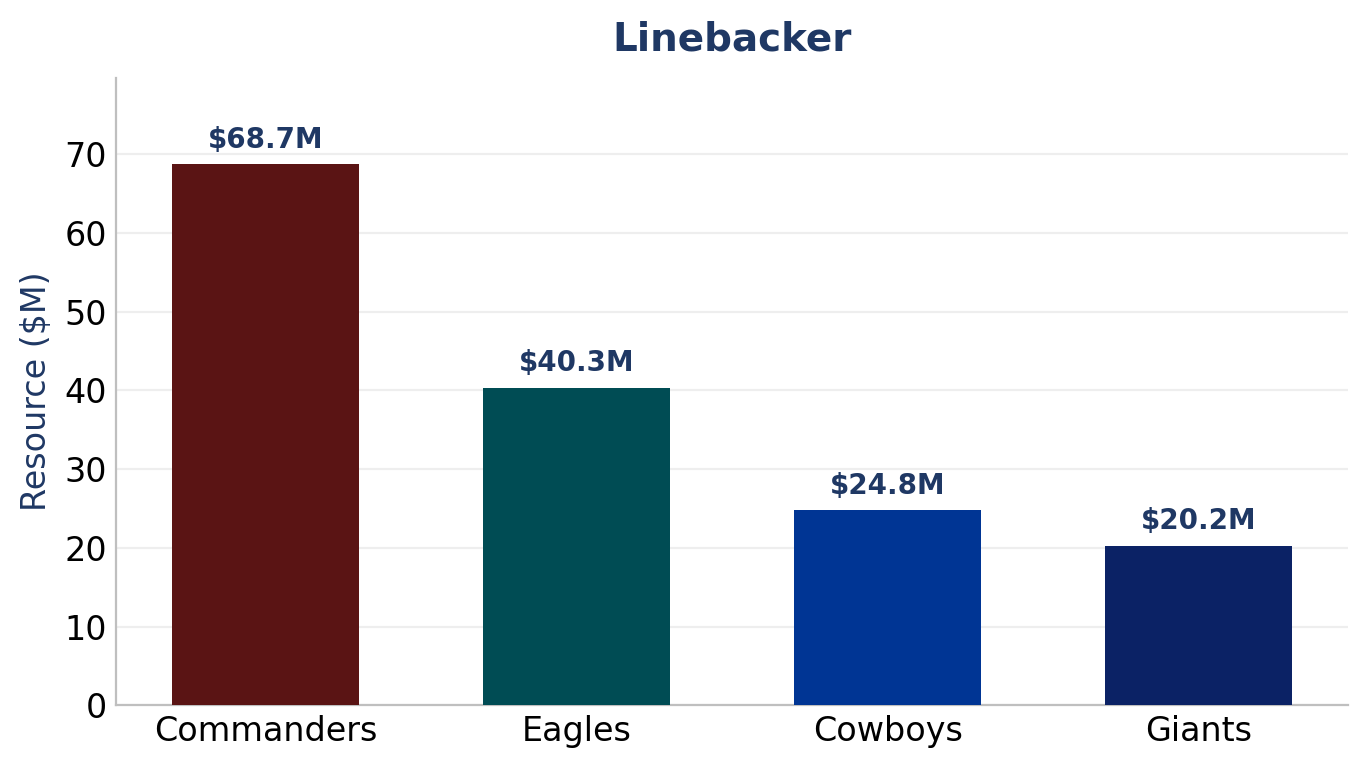
Off-ball linebacker, with the edge rushers counted where they belong on the defensive line, is where the division splits hard.
Washington ($68.7M) is the outlier, and it is almost entirely one player. Sonny Styles carries $45.7M of resource value as a 2026 top ten pick, which on its own is more than any full off-ball room in the division. Frankie Luvu ($9M) and Leo Chenal ($8.8M) fill out the rest. The Commanders have made an enormous bet on a position group other teams largely bet small on.
Philadelphia ($40.3M) is built around Zack Baun’s $17M, a modest price for an All-Pro, plus Jihaad Campbell’s rookie pick value. Dallas ($24.8M) runs cheap, Marist Liufau and DeMarvion Overshown on rookie and near-minimum deals.
New York ($20.2M) is the lowest off-ball linebacker spend in the division. Tremaine Edmunds at $13M and not much behind him. That is the cost of the Giants’ defensive build. They put $152 million into the line and $103 million into the secondary, and the off-ball linebacker room is what got left on the cutting-room floor.
Secondary
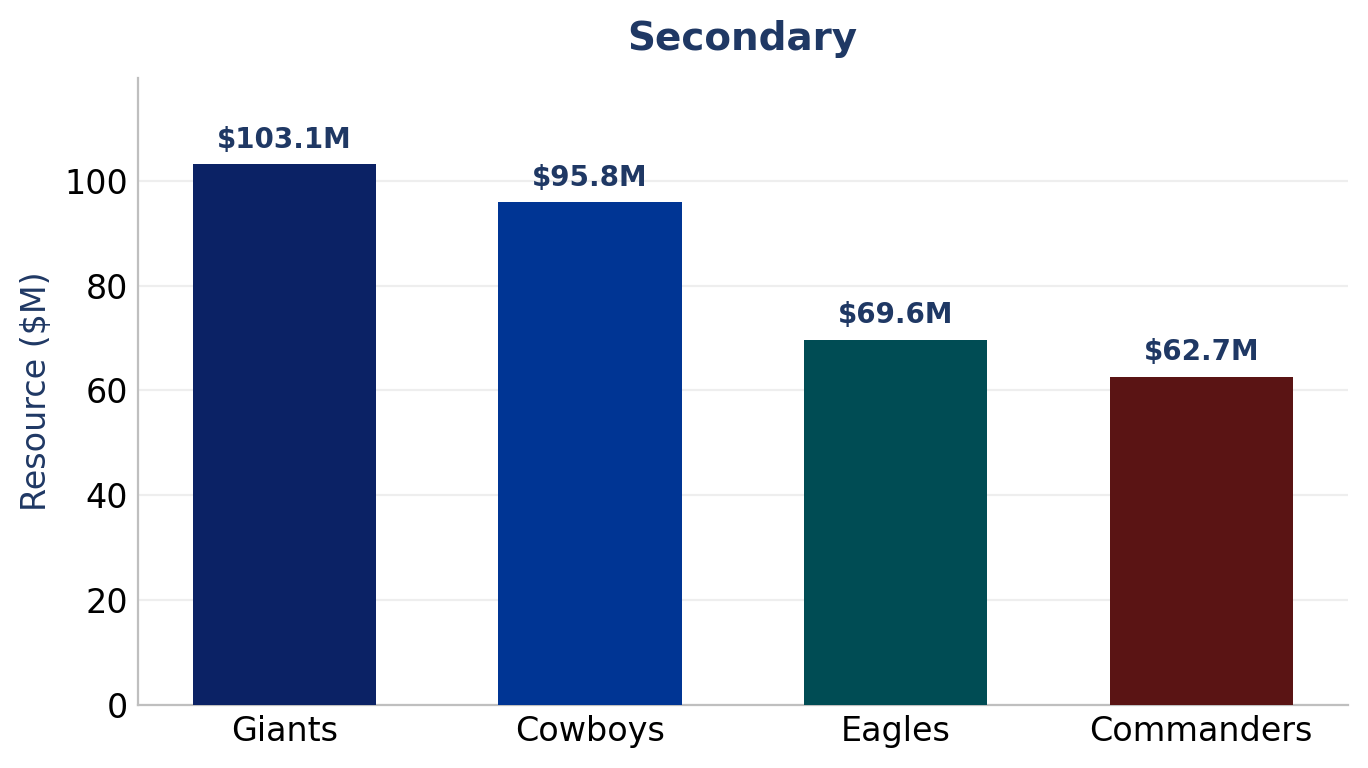
The clearest top-to-bottom divergence in the division. Two teams have built premium secondaries. Two have not.
New York ($103.1M) is the highest secondary figure across all twelve teams tracked, clearing Chicago’s week-one $86M by roughly the cost of a premium player. Paulson Adebo ($18M) and Jevon Holland ($13.5M) on the veteran side. Deonte Banks, Colton Hood, Tyler Nubin, and Dru Phillips on rookie capital. The Giants stacked cash and picks at the same position at the same time, the same move that put their defensive line on top.
Dallas ($95.8M) sits second on the strength of Caleb Downs’s $37.1M as a projected 2026 first round pick, plus DaRon Bland at $13M and Jalen Thompson at $12.5M in cash. Two premium-priced secondaries in one division.
Philadelphia ($69.6M) is built youngest and cheapest at the top. Quinyon Mitchell, Cooper DeJean, and Andrew Mukuba carry $41.5M of pick value against $28.1M of cash. The Eagles have the most cost-controlled high-end secondary in the division, which is becoming a theme with them.
Washington ($62.7M) is the lowest, running through rookie-deal contributors Quan Martin, Mike Sainristil, and Trey Amos. The Commanders spent at the line and the offensive front and let the secondary stay young.
Special Teams
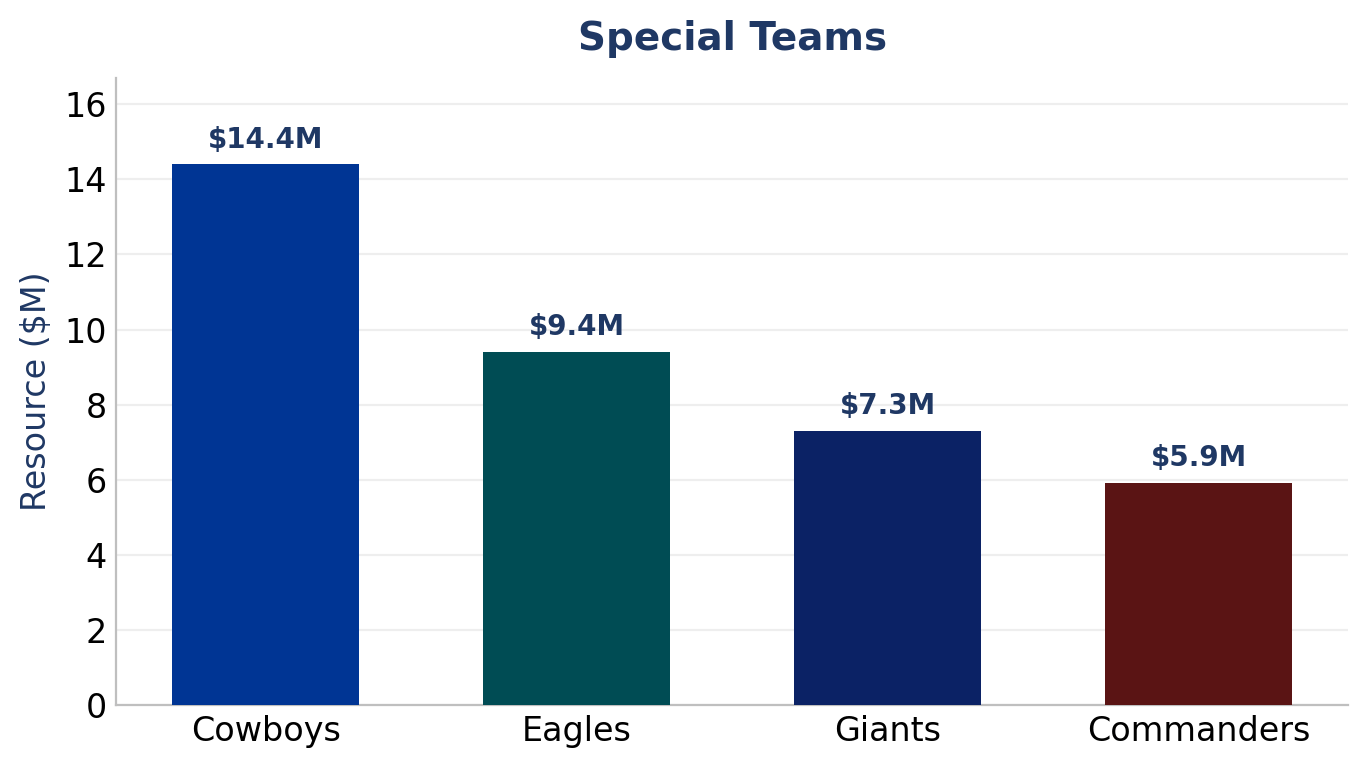
Dallas ($14.4M) tops the division and ranks near the top of the league, driven by Brandon Aubrey's $10M kicker contract. For the second straight division, the special teams leader is a team paying a premium for a kicker rather than a punter. Washington ($5.9M) is the lowest, with Tress Way punting and cheap deals around him. A real $8.5 million gap from top to bottom on a group everyone claims not to value.
Three Divisions In - A Macro Look
Twelve teams in, the NFC East rewrites the running story. The first two divisions each had a clear bottom, Minnesota and Atlanta, dragging the floor down and widening the spread. The East has no floor to speak of. Its lowest team would rank as the second highest in the South. Its spread is a third of what the other divisions produced.
That matters for what the salary cap is supposed to do. The cap was built to flatten spending and keep any one team from buying a roster. But practically speaking it doesn’t flatten cash spending, nor does it flatten the accumulation of assets. And we now see that it doesn’t stop an entire division from operating above the league average at once. Four teams, all spending like contenders, all in the same division, all chasing each other. The cap did not prevent that. It may have caused it, by forcing these front offices to compete on draft capital and contract structure rather than raw dollars.
The question this division leaves open is the one the season will answer. When four teams all commit at this level, resources stop being the differentiator. Construction does. The Giants bought the most expensive defense I have measured. The Eagles built the most balanced across all position groups. The Cowboys paid up where it counts and drafted the trenches. The Commanders bet the roster on a premium quarterback that currently costs them just $4.2 million in cash.
Four teams putting their money where their mouth is. Four different theories of how to win. We will find out which theory was right. And in doing so we will find the true differentiator that causes real parity in the NFL. Return on investment. For other divisions, the disparity in performance can easily point to who is dedicated from the top to putting the best product on the field. But here in the NFC East, it’s going to come down to who does the most with similar assets.
My draft pick valuation process places a value on the pick agnostic to the player actually selected. Teams make bets on veterans every time they place pen to paper. The performance delivered for these choices can and will write the final story on how these teams wind up come early 2027.
“For other divisions, the disparity in performance can easily point to who is dedicated from the top to putting the best product on the field. But here in the NFC East, it’s going to come down to who does the most with similar assets.”
Methodology Note
The 53-man rosters are projected from Ourlads depth charts. Rookie pick values are from my proprietary 2026-normalized draft pick value model, annualized over four years. Cash figures are from Spotrac’s 2026 cash tables. UDFAs and players on cap-minimum vet deals are valued at their actual 2026 cash. Players who have signed extensions beyond their original rookie deal are treated as veterans (using cash), not as rookies (using pick value), regardless of whether they were drafted by their current team.
Position groups: QB, RB, WR, TE, OL, DL (IDL + EDGE combined), LB, SEC (CB + S combined), and ST (K, P, LS).
No positional adjustments are applied to pick values. A running back taken at #3 carries the same resource value as a quarterback taken at #3 in this framework. This is a deliberate choice consistent with the goal of measuring resource commitment, not expected return.
What’s Next
Next week I head to the NFC West to close out the conference, then on to the AFC North, South, East, and West. At the end of the series, I will pull back for a league-wide look and hunt for the anomalies, the patterns, and whatever it is the perennial contenders keep doing that the rest of the league does not.