
NFC South Resource Allocation
Second up in a nine-part series, looking at how the NFC South builds their rosters

This is the second piece in a nine-week project. Each week I take one division, build a single comparable resource value for every player on every projected 53-man roster, and lay out what the numbers describe. Last week, I profiled the NFC North. This week, the NFC South gives us a different kind of outlier, and the first cross-divisional patterns start to surface.
I go into greater detail on the methodology in last week’s intro piece linked above, but the tl;dr version is I look at actual cash spending devoted to a roster rather than cap accounting and layer in draft resource allocation through my own draft pick valuation chart, which uses the NFL salary cap to establish a financial value as opposed to a points system. This creates a single currency for evaluation.
The NFC South From 10,000 Feet
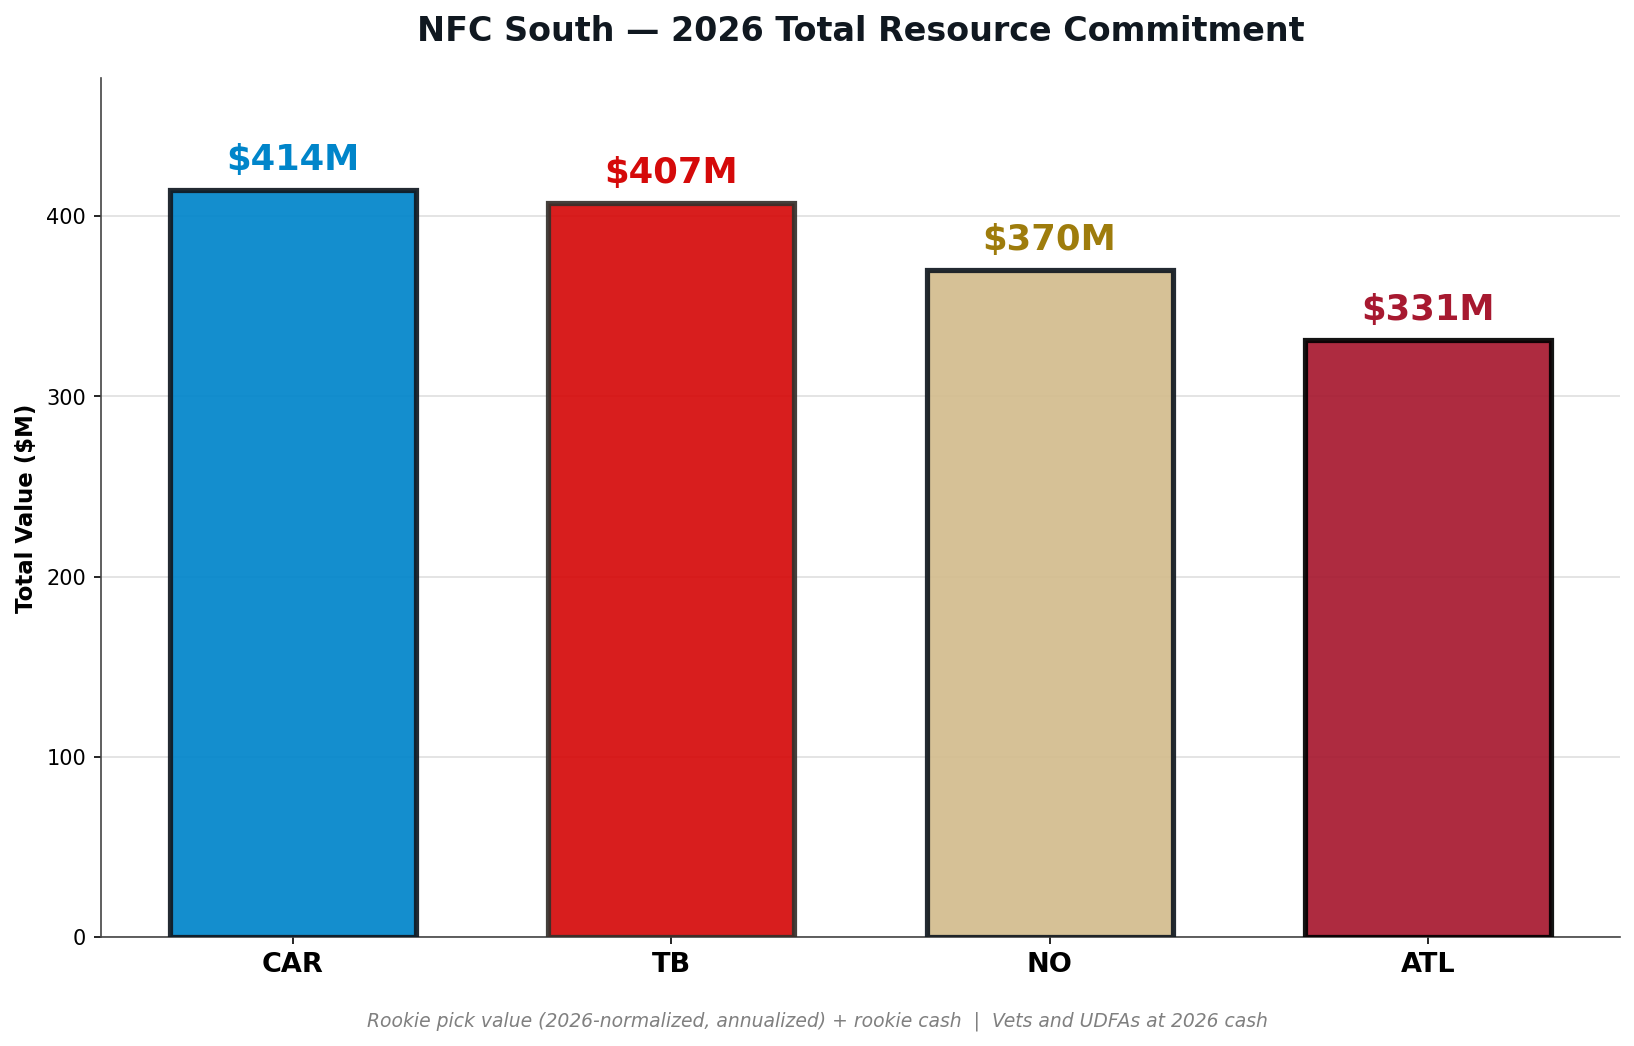
Before I get to the divisional breakdown, I do want to call out an interesting macro-level point. In the NFC North deep dive, I accused the Vikings of building their team with bubblegum and cheap vets. That analysis, while correct within the division, may have been a bit premature when taken within a broader context. At $365 million in total asset allocation, they were $100 million off of the next closest division rival.
But if Minnesota was in the NFC South, they would be within spitting distance of the Saints and certainly in the divisional cluster. If we look at the two divisions comparatively, well…there is no comparison. The NFC North is working with close to $1.8 billion in assets on the field. The South is trailing by 15%. It doesn’t seem like much until you realize it is a $267 million disparity. That’s a $66.75 million per team difference.
The highest paid player in the NFL currently makes $60 million per year. When allowing for bust risk and positional variance, the #1 overall pick is worth about $33 million per year. The NFC North is essentially playing in a league with 1-2 extra superstars per team than the South from a resource standpoint. It also helps better clarify the .255 spread in non-divisional record over the last three years between the two groups (assuming that this resource disparity is a year-over-year trend, which admittedly, I have not confirmed). Now back to the South.
“The NFC North is essentially playing in a league with 1-2 extra superstars per team than the South from a resource standpoint.”
And this isn’t a function of additional spending in a few key positions. The North devotes more resources to almost every position group.
The South averages $26.6M at QB versus the North's $45.5M ($18.9M gap), $24.7M at LB versus $36.8M ($12.1M gap), $57.8M in the secondary versus $69.8M ($12M gap). The only position group where the South outspends the North on average is running back, where New Orleans's $36.2M outlier carries the division.
Carolina is pushing their chips all-in after a surprising playoff appearance last year. The Bucs and Saints trail fairly close. But just like with the NFC North, there is a division laggard in the Falcons, who just completely turned over their leadership team.
Atlanta isn’t spending much in cash, ranking 30th in the NFL. They also lead all eight teams profiled so far in rookie pick share at 49.1%. Last week’s NFC North leader was Chicago at 44.9%. Atlanta is more rookie-heavy than the Bears were. That makes sense for a team looking to reset after said leadership change.
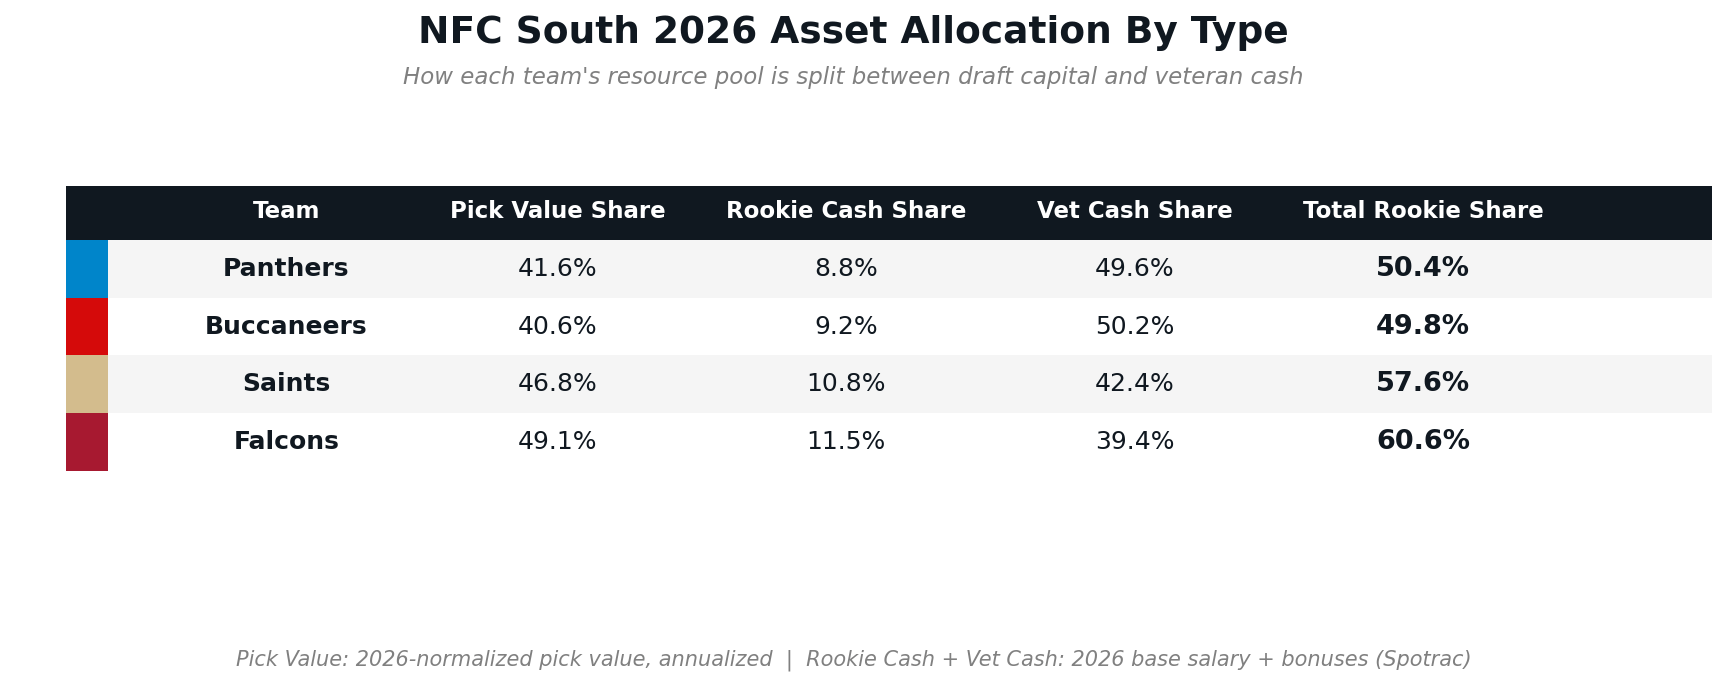
In addition to the note above about Atlanta being the draft-heaviest team, there are other notable takeaways here. Carolina and Tampa Bay are nearly identical in mix. Both teams sit between 40.6% and 41.6% rookie share, with vet cash shares within half a point of each other. Two organizations with very different styles have arrived at nearly the same resource construction. They are also the two most proportionally cash-heavy teams across both divisions tracked.
New Orleans sits in the middle at 46.8% rookie share, slightly tilted toward draft capital. The Saints have four round-one picks still on original rookie deals: Jordyn Tyson, Kelvin Banks Jr., Taliese Fuaga, and Bryan Bresee. Four first-rounders on rookie wages across four consecutive draft classes is a real pipeline if they meet their median outcomes or better. With Bresee that seems unlikely. The jury is still out on the other three.
What this share does not tell us is whether higher or lower is better. It tells us how much of each roster is still cost-controlled and how much has already been paid. A higher rookie share means more upcoming second-contract decisions. Atlanta has those decisions stacked in front of them. Carolina hasn’t had to make many recently due to the Bryce Young trade. And the most important one, on Bryce Young, is still looming. Neither is automatically correct.
Cash vs Draft Capital, Team by Team
While the earlier graph shows a total team commitment in resources, I like looking at the shape of commitment by resource type. The cash radars look broadly similar across teams: large at DL, OL, somewhere in the secondary. That is what veteran contracts buy. The draft capital radars are where the four teams diverge most clearly. Different front offices have spent their picks on different position groups.
Atlanta Falcons
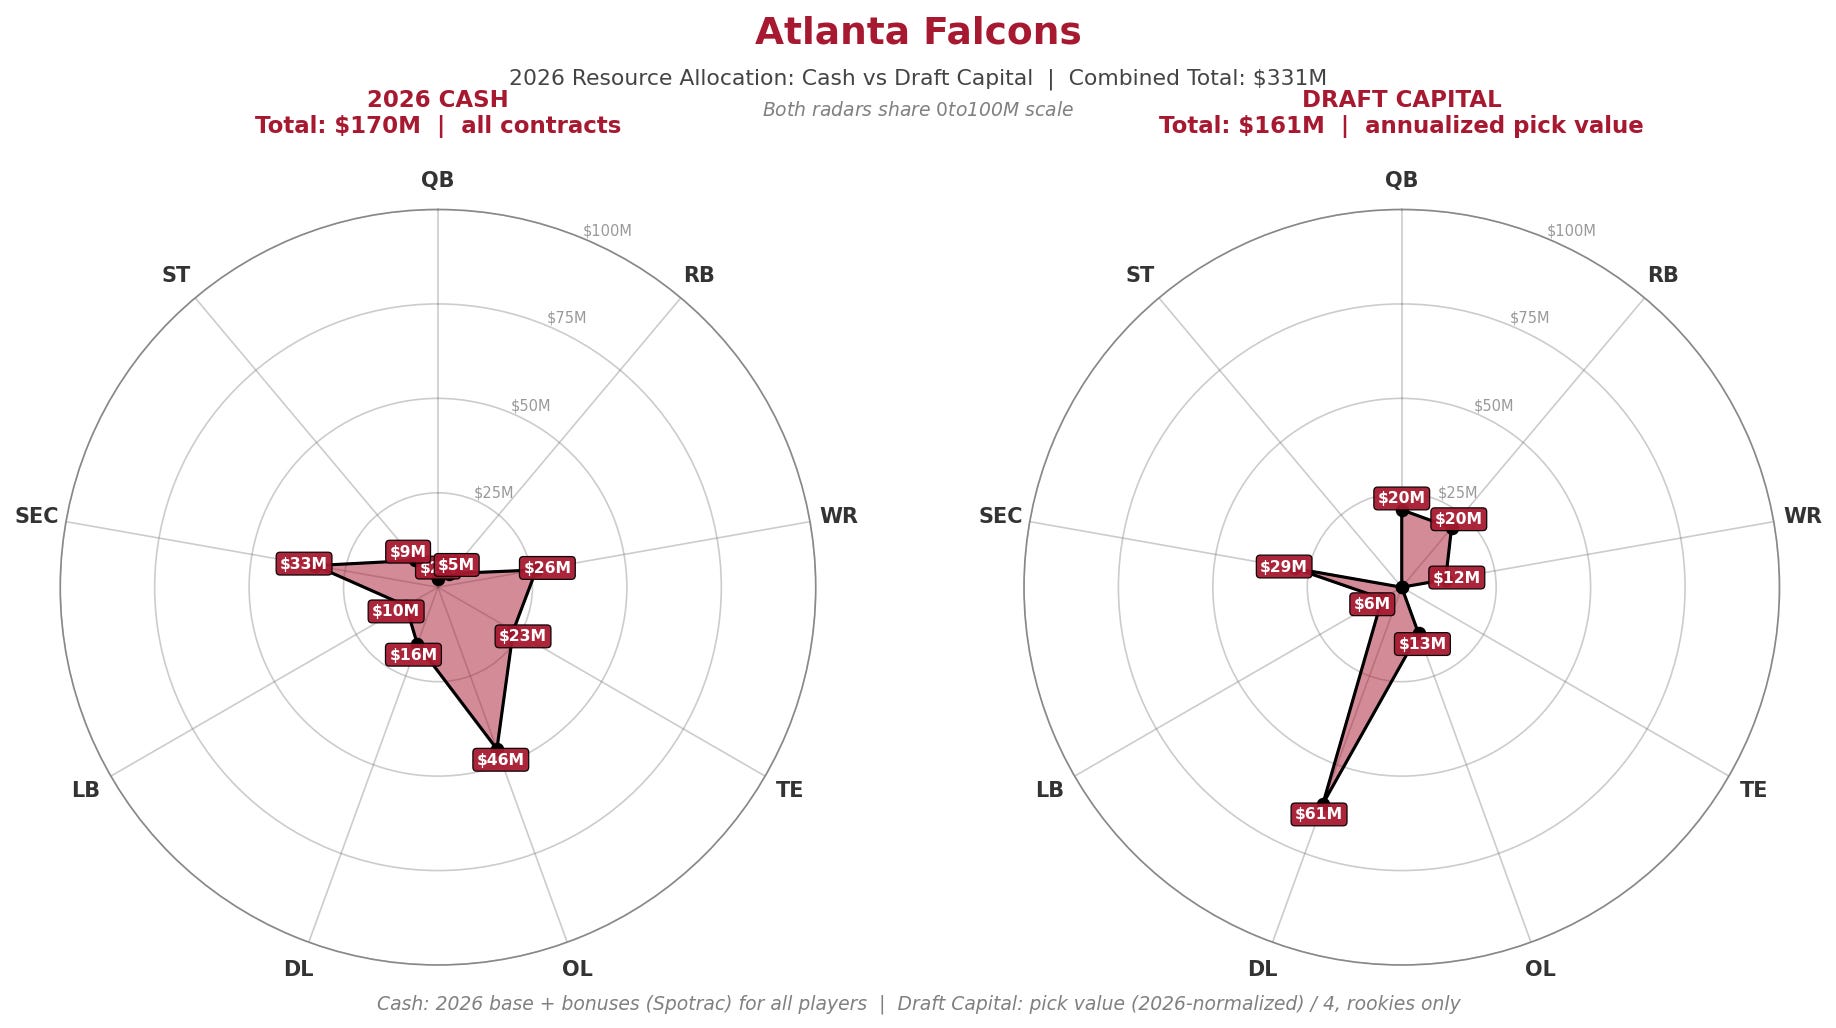
Atlanta’s cash side is flat by NFL standards. The OL ($45.6M) leads. The secondary ($33M) comes second on the A.J. Terrell extension and the Jessie Bates III contract. WR ($28.3M) comes third on the back of Drake London’s fifth-year option. Nothing on the cash side reaches the third ring. Atlanta is the only team in the division without a single position group exceeding $50M in cash.
The draft capital side tells a different story. DL ($64.1M) is the largest pick-value cluster in the entire division. Jalon Walker ($16.9M annualized) and James Pearce Jr. ($13.8M) make it a two-headed top-end EDGE rotation entirely on rookie deals. The secondary ($28.6M) and QB ($20.5M, all Penix) and RB ($20.5M, all Bijan) fill out the rest. Atlanta’s draft capital radar is the most concentrated of any team in the division.
This also highlights the thin needle the Falcons did thread with Robinson. His draft pick value as the eighth overall pick carries the same value as the APY on Saquon Barkley’s record-setting contract. Now, I fully expect Robinson’s next contract to go for more than Barkley’s current APY, but it will be a small upward margin showing Atlanta got very little surplus value from picking Robinson, but the pick did pay off in absolute terms.
The Falcons haven’t traded away aging veterans. But they also have yet to sign their young cornerstones to second contracts. Robinson, London and Kyle Pitts are all extension eligible and all awaiting their next big deal. For a city that is home to the busiest airport in the world, perhaps it is fitting that they have left their three biggest stars in a proverbial holding pattern.
New Orleans Saints
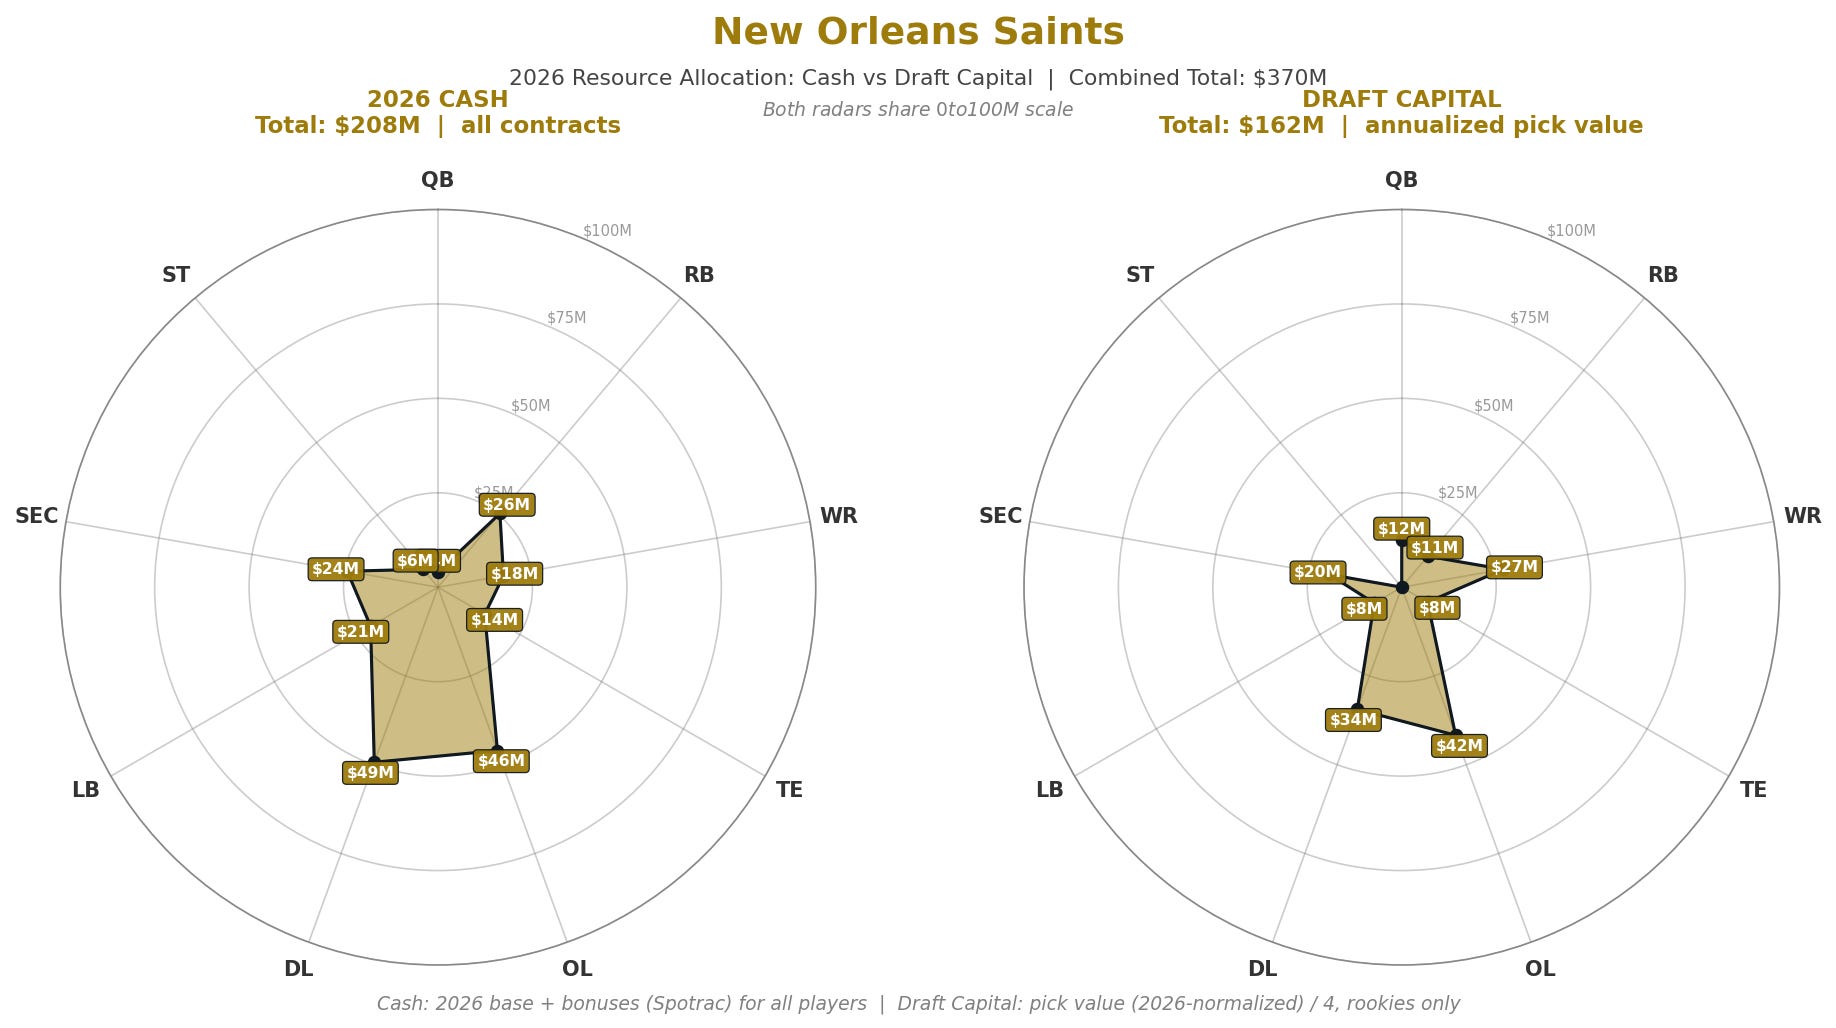
New Orleans’s cash side is OL-heavy ($46M) on the strength of David Edwards’s new contract, Erik McCoy, and Cesar Ruiz. DL ($49.3M) is close behind on Granderson, Chase Young, and Davon Godchaux. The shape leans defensively flat and offensively OL-anchored. The draft capital side leans most heavily into the OL ($41.7M) with Banks Jr. and Fuaga doing most of the work, and DL ($34.4M) with Bresee and the rookie depth. WR ($27.3M) is unusually high for pick value because Tyson sits at the #8 overall slot at $20.5M annualized.
The last great version of the Saints was built on a historic 2017 draft class. This version is making a bet on a second-round quarterback who could bridge them from a self-imposed cap cage to a future full of cash and cap freedom.
Carolina Panthers
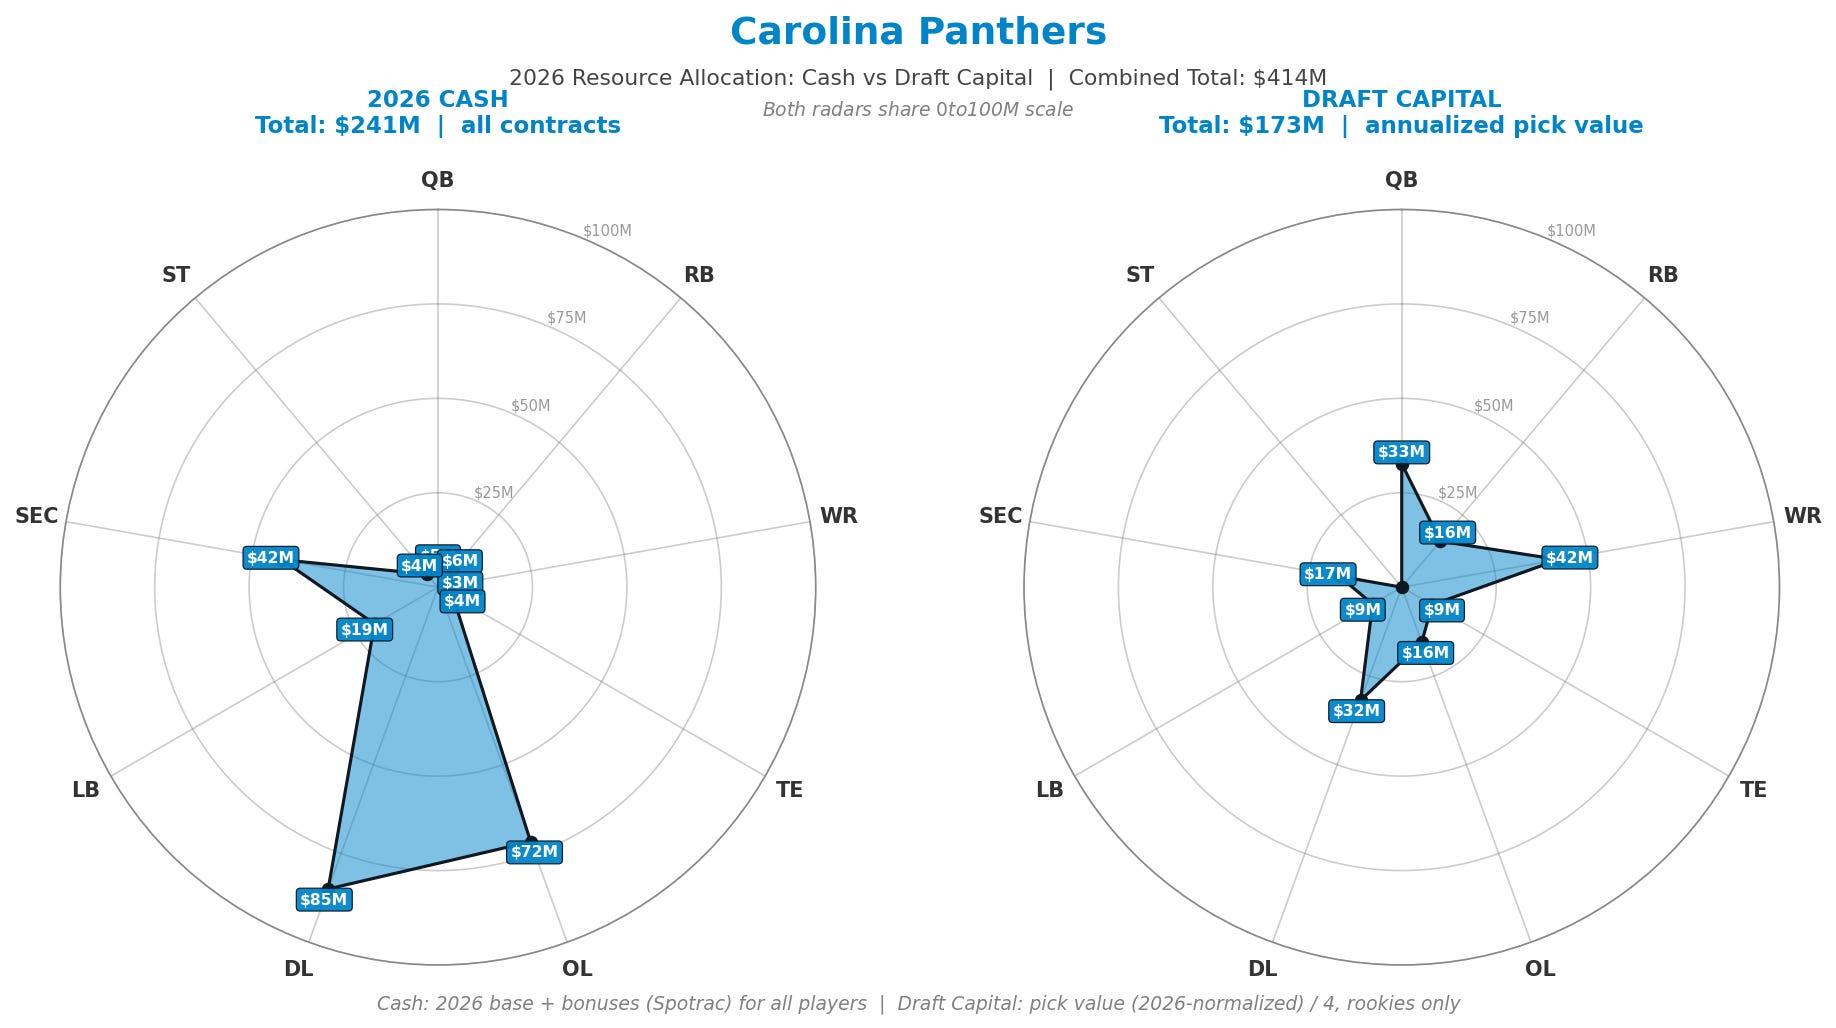
Talk about building in the trenches! They have invested over $150 million in cash to building out their offensive ($71.7 million) and defensive ($85 million) lines. Spending $36.24 million in year one cash for Jaelan Phillips will help get you there fast. But they also have $19.5 million devoted to Derrick Brown, $14 million to Tershawn Wharton, $19 million to Robert Hunt and $14.2 million to Taylor Moton and $13 million to Damien Lewis.
With $41.9 million in cash dedicated to the secondary the Panthers have three position groups clearing the $40 million mark. No other team in the division has more than two.
The draft capital radar is more even. WR ($42.2M) is the largest pick-value bucket on the strength of Tet McMillan and Xavier Legette. QB ($32.7M) is all Bryce Young at the #1 pick value. DL ($31.9M) sits third on Lee Hunter, Nic Scourton, and Princely Umanmielen. Carolina has poured cash into the offensive line while keeping the skill positions on rookie capital and using both on the defensive line.
Tampa Bay Buccaneers
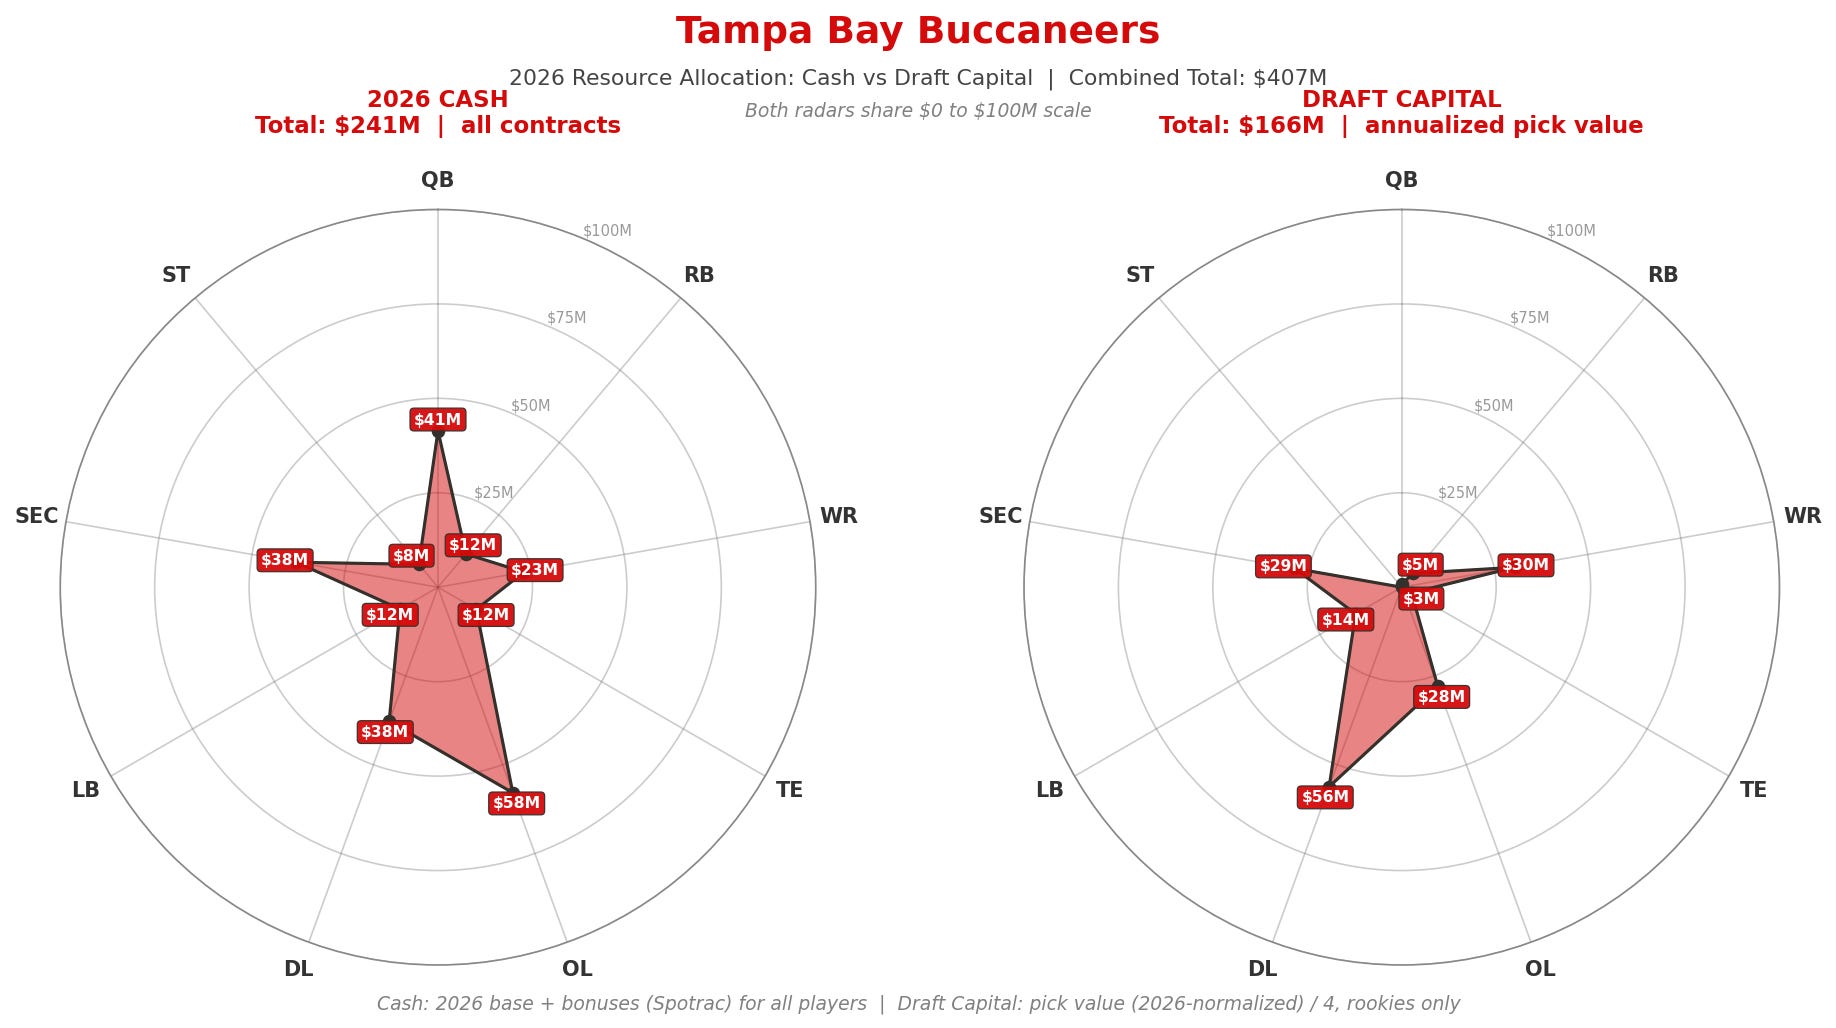
Tampa Bay’s cash radar is the most diversified in the division. Six position groups sit between $11M and $58M, with no single extreme spike but no glaring hole either. QB ($42.3M, basically all Mayfield), OL ($57.9M), DL ($37.8M), WR ($23.1M), SEC ($38.1M) all carry real veteran commitments.
A substantial portion of those cash commitments go to homegrown players who they love to reward with second contracts. Strategically, the Bucs have shown their policy is “spend money on good players regardless of position”. The beauty is in its simplicity. And it has led them to some surprising first-round draft picks that fell outside of the conventional “team need” trope.
But it has also led them to play whack-a-mole offseason-after-offseason chasing one leaky position group after another. Secondary in 2025, linebacker and defensive line in 2026. And the song plays on.
The draft capital radar leans into DL ($56.2M) on the strength of Rueben Bain Jr. ($16.9M annualized), Calijah Kancey ($15.6M), and YaYa Diaby. WR ($30.4M) comes next with Egbuka and Jalen McMillan. SEC ($28.8M) on Morrison, Parrish, Tykee Smith. OL ($27.9M) on Barton and Mauch.
Tampa Bay is the team most evenly investing across position groups. They are 21st in cash spending leaguewide but stack one of the deeper rookie pipelines in the league underneath, which is how they end up second in total resource commitment in the division despite middling cash outlay.
Where the Money Actually Goes
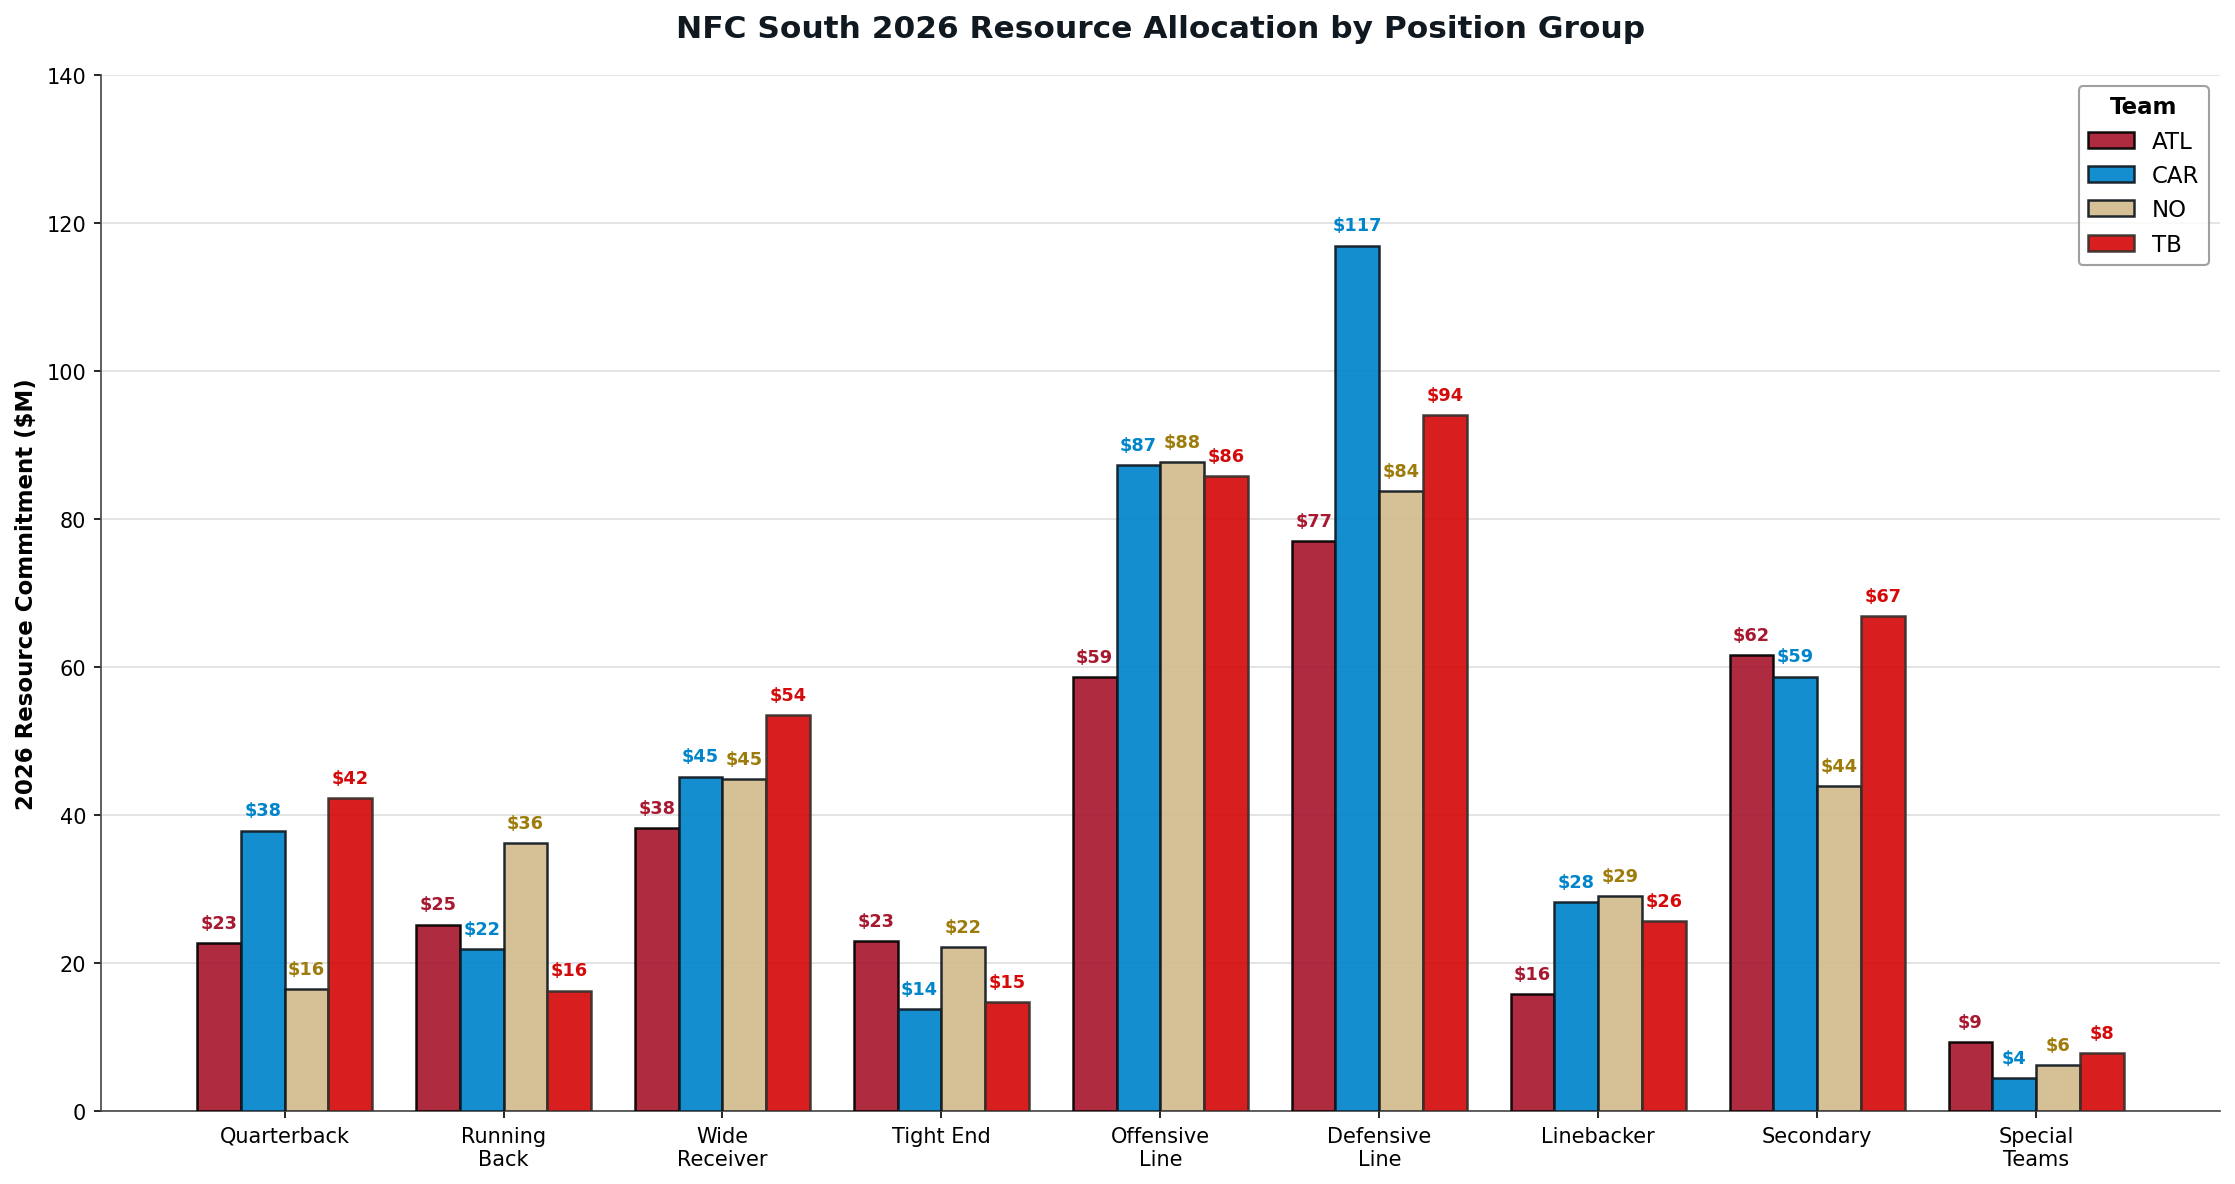
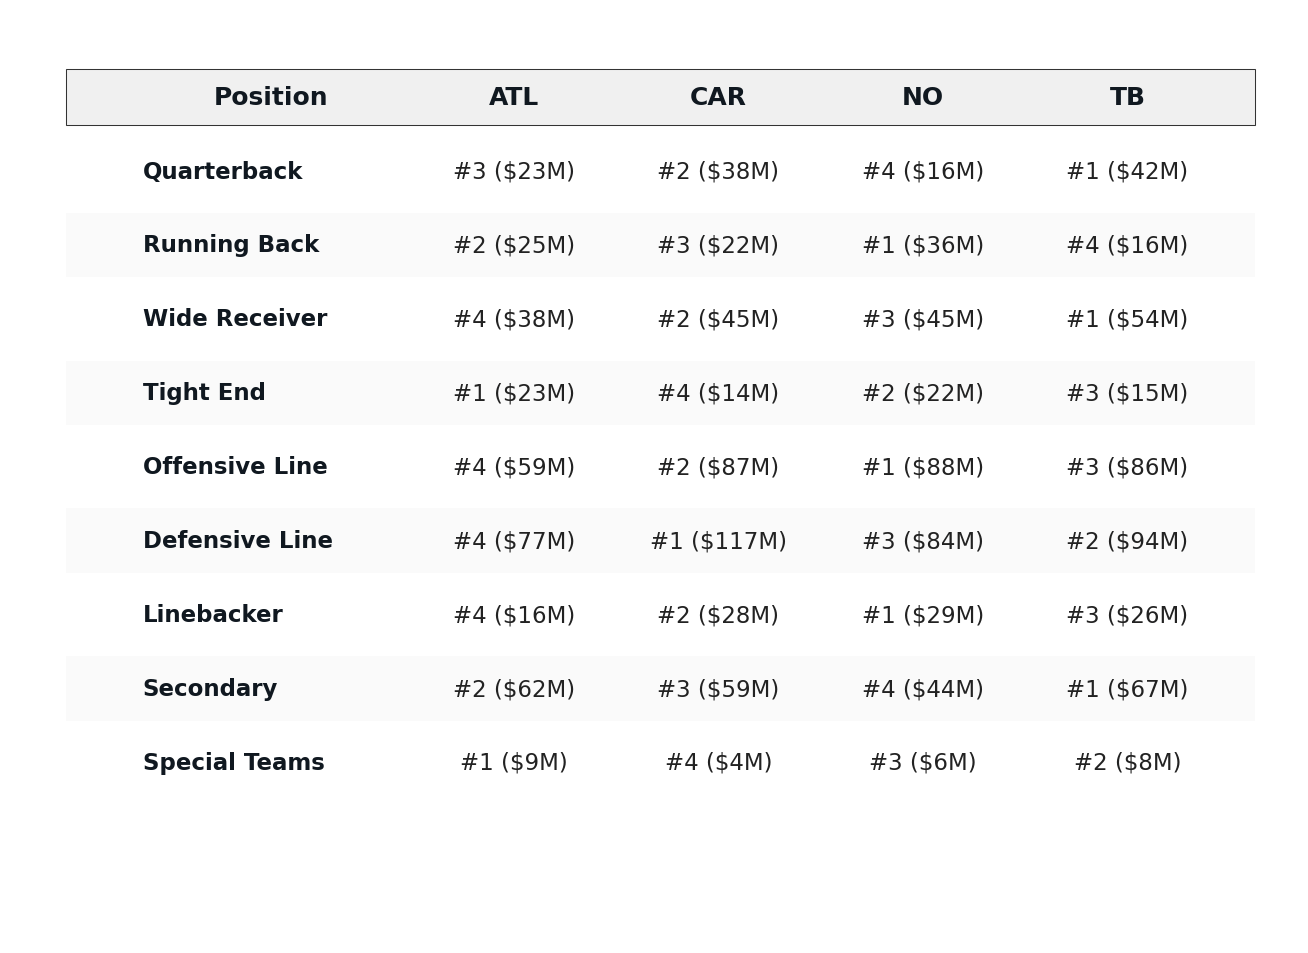
Looking at each team set against each other by position group gives the cleanest view of what each front office values. Each team spends in roughly the same order at the top: DL first, OL second, somewhere in the secondary or QB third. That order is largely governed by the size of the position group. The specific deviations sit further down, and that is where each front office’s philosophy actually shows up.
Quarterback
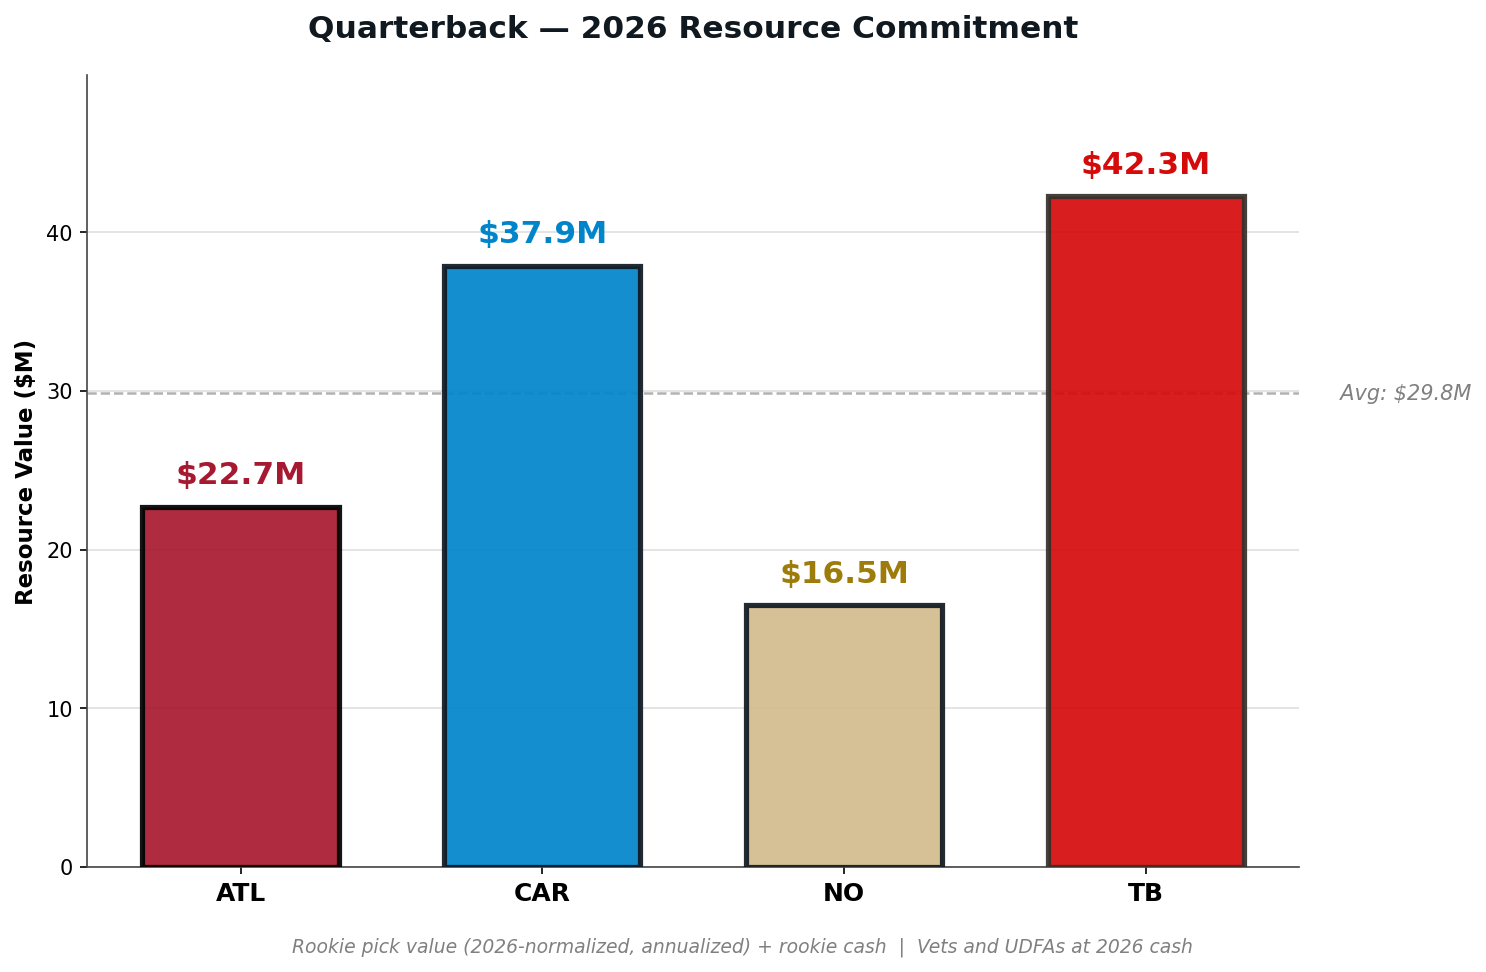
Tampa Bay ($42.3M) is the most expensive room in the division with Baker Mayfield making $40 million on the final year of his 2024 extension. The Bucs are paying full freight on a quarterback they once paid the league minimum to take a flyer on. Good problem to have, but a change from their former situation.
Carolina ($37.9M) sits second on the strength of Bryce Young’s #1 overall pick value at $32.7M annualized. Young’s actual cash hit for 2026 is $5.9M. The gap between those two numbers, just under $27 million, is the structural advantage Carolina has at the position. Drafting Young at #1 cost Carolina roughly what signing a mid-tier veteran QB would have cost. The cash flexibility is the structural advantage rookie QB contracts offer. Is Young worth that valuation? It looks like the Panthers are deferring that decision for another year as they have simply picked up his fifth-year option for 2027 at just under $26 million.
Atlanta ($22.7M) is running a quieter version of the same play with a cheap audible attached. Michael Penix Jr. at #8 overall carries $20.5M of pick value against $2.9M of actual cash. Same structural advantage Carolina has, just at a slightly cheaper pick slot. The difference is in execution: Carolina’s bet is on Year 4 of a #1 overall whose contract leverage is about to flip; Atlanta’s bet is on Year 3 of a #8 overall with two cheap years still ahead. Atlanta is, structurally, where Carolina was two offseasons ago. They have also signaled they may not wait like Carolina has. They have Tua Tagovailoa on a league-min deal while the Dolphins keep paying him big bucks to not play for them. That reads as an obvious hedge: Atlanta is willing to move on from Penix earlier than Carolina is willing to move on from Young.
New Orleans ($16.5M) is the cheapest QB room in the league, and based on a small sample size, may turn out to offer the most surplus value. Tyler Shough, at #40 overall ($11.3M annualized), doesn’t represent a significant asset investment. But if he turns into a franchise quarterback, the Saints get top value at the most expensive position while still getting the benefit of a first-round pick in Shough’s draft. It’s not hyperbole to say the Shough pick could be the most consequential roster move in the NFC South for the next decade.
“It’s not hyperbole to say the Shough pick could be the most consequential roster move in the NFC South for the next decade.”
Running back
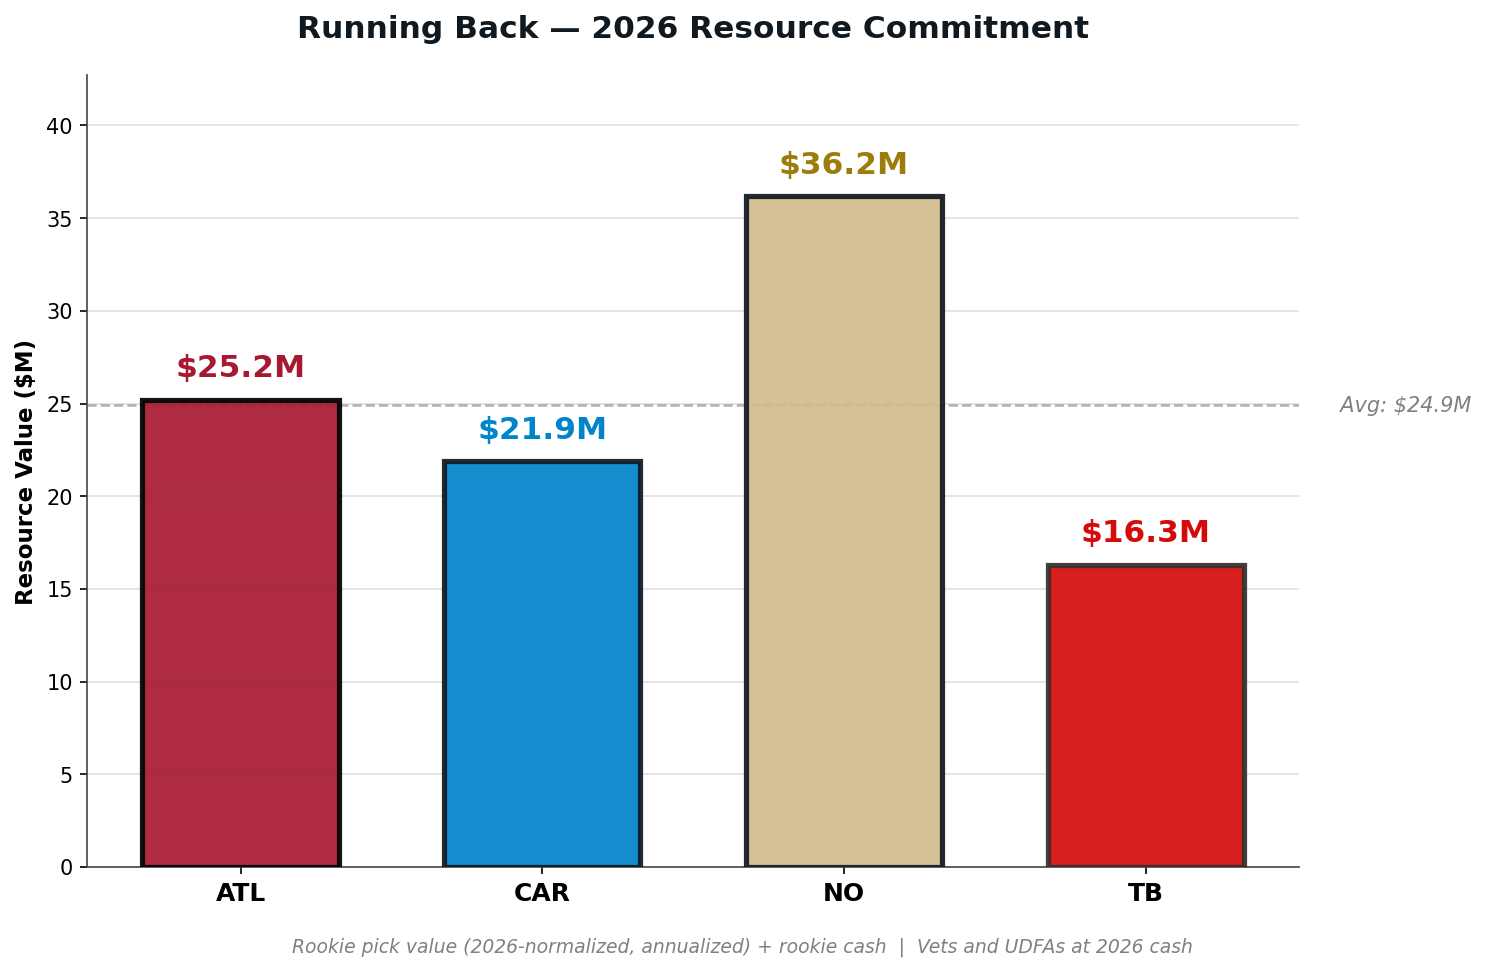
New Orleans ($36.2M) is the running back outlier in the division and the leader across all eight teams tracked. Travis Etienne Jr. at $14M plus Alvin Kamara at $11.5M plus Kendre Miller’s pick value. That is two veteran starters making real money. Through eight teams, no other team has more than Detroit’s $30M at the position. The Saints are out alone on a limb at running back.
Atlanta ($25.2M) is driven almost entirely by Bijan Robinson’s #8 pick value of $20.5M. Same Jahmyr Gibbs case from last week. Bijan’s next contract should pay him more than that. Atlanta’s bet on him has paid even money plus a small premium.
Carolina ($21.9M) and Tampa Bay ($16.3M) round out the bottom. Chuba Hubbard plus Jonathon Brooks plus Trevor Etienne in Carolina. Bucky Irving plus Kenneth Gainwell in Tampa. This is conventional modern construction at the position.
Wide Receiver
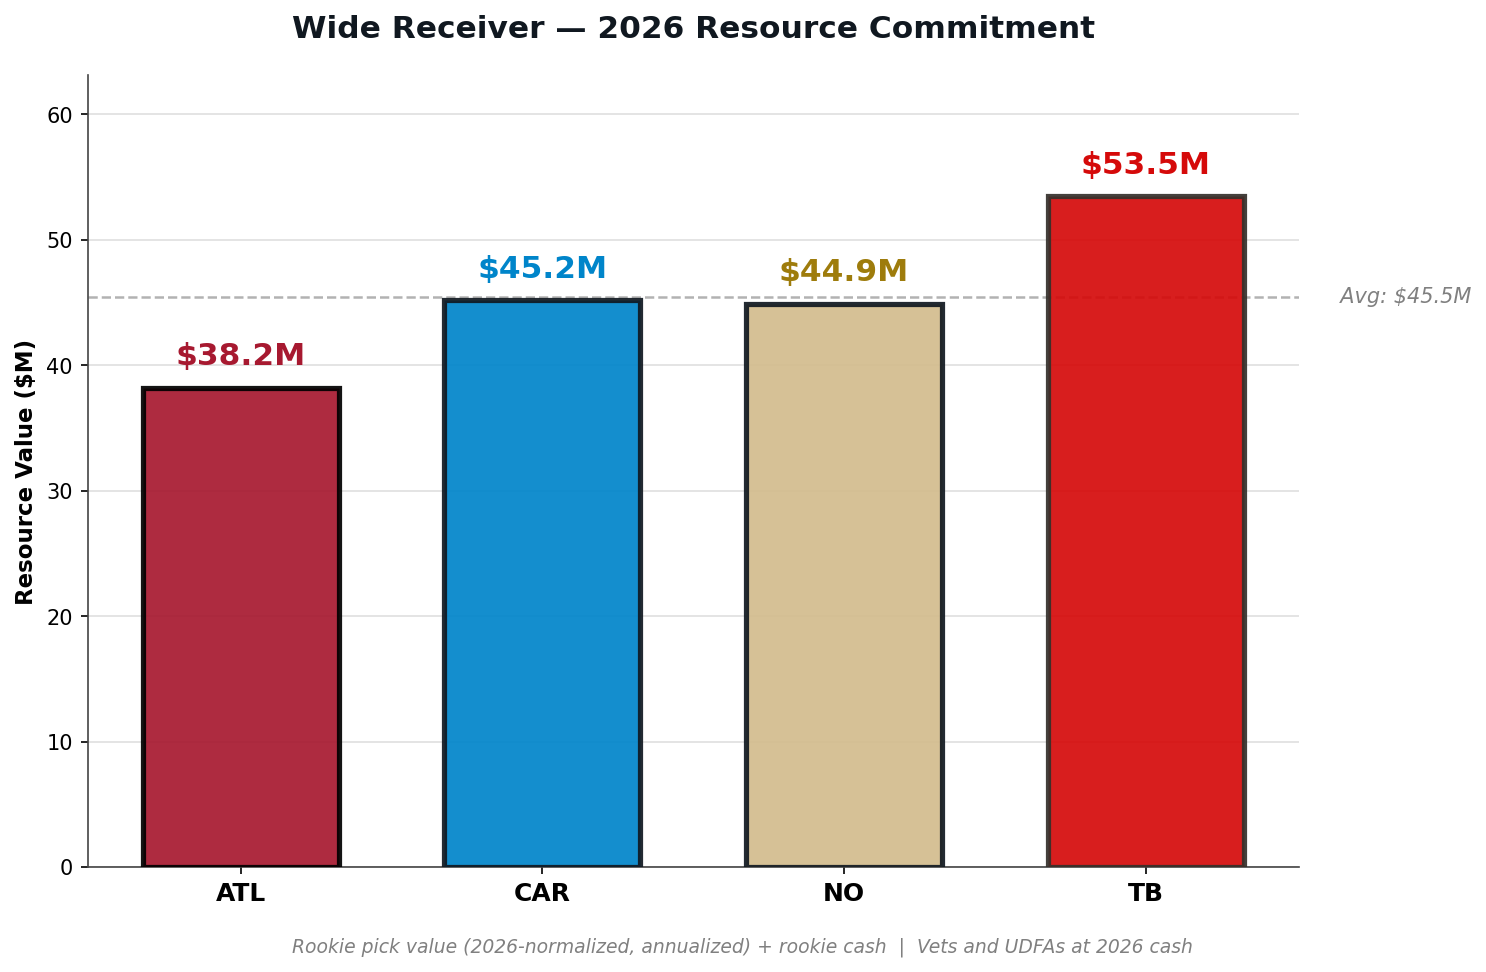
Tighter than expected, with Tampa Bay just clear of the field. Chris Godwin Jr.’s $22M APY extension does most of that work, with Emeka Egbuka’s pick value ($14.7M) adding to it. Add Jalen McMillan and Ted Hurst and you have one of the most layered receiver rooms in the league. Across eight teams, only Green Bay ($66M) has invested more at the position.
Carolina ($45.2M) builds it differently. Tetairoa McMillan’s pick value at #8 overall is $20.5M annualized. Add Xavier Legette at $12.6M annualized plus Chris Brazzell II’s round-three pick value and you have a rookie-first model.
New Orleans ($44.9M) is anchored by Chris Olave’s $15.5M fifth-year option. Then Jordyn Tyson’s #8 pick value at $20.5M annualized takes the second slot. Both can provide surplus value this year. The rest of the room is on minimum or rookie deals.
Atlanta ($38.2M) is the lowest of the four and the lowest across all eight teams tracked. Drake London at $16.8M on his fifth-year option plus Jahan Dotson at $8M lead the room. The Falcons have invested less in the WR room than any team in either division. But that could soon change with a London extension that should be an eventuality.
Tight End
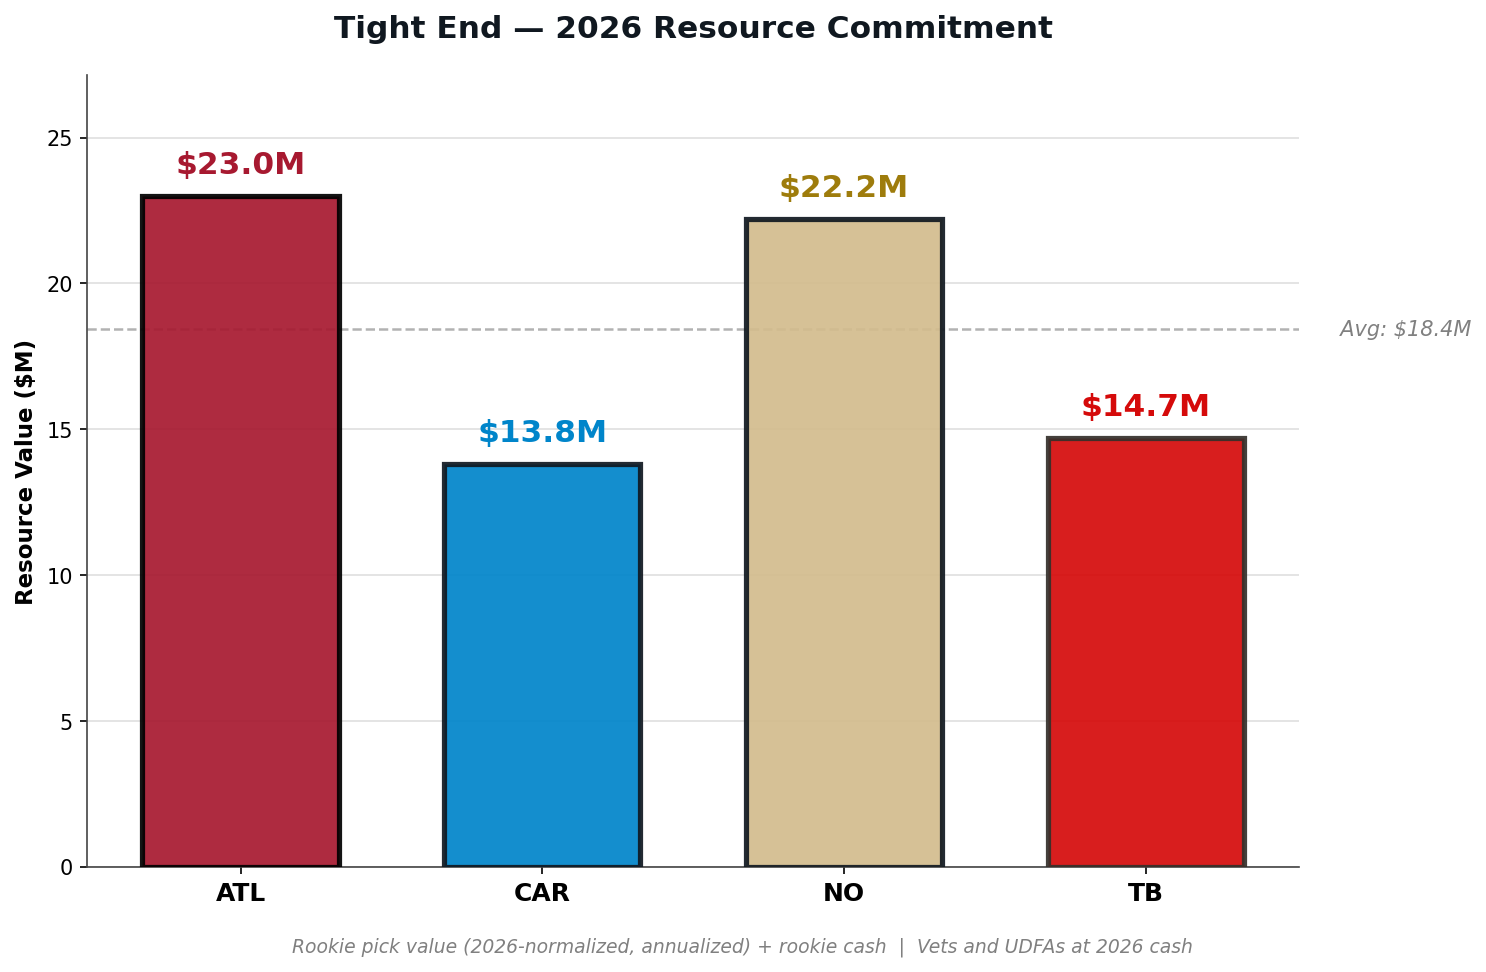
Last week, Chicago at $40M at TE was the largest position-group outlier in the NFC North. This week, the NFC South shows Chicago continues to be an outlier. Atlanta and New Orleans cluster at the top in the low $20s. Tampa Bay and Carolina sit in the mid-teens.
Atlanta ($23M) is the closest thing to Chicago the South has. Kyle Pitts on his fifth-year option at $15M is the highest paid player at the position in the division. Austin Hooper at $3.25M, Charlie Woerner at $4.75M add close to $10 million to the room. Pitts has not produced like a #4 overall pick, but the financial commitment is still there. Whether it pays off depends on production. The resource commitment is real.
New Orleans ($22.2M) is built on Juwan Johnson’s recent extension ($9.83M), Noah Fant ($4.5M), and Oscar Delp’s round-three pick value fill out the rest of a more balanced room.
Carolina and Tampa are both in the mid-teens with more modest commitments to the position. Tommy Tremble in Carolina. Cade Otton in Tampa, on a recent extension. Neither team is making the position a strategic priority.
Through eight teams, the TE position remains the most divisive resource decision in football. Chicago at $40M is the only team paying real resources at the position. The other seven sit between $9M and $23M. The league has not converged.
Offensive Line
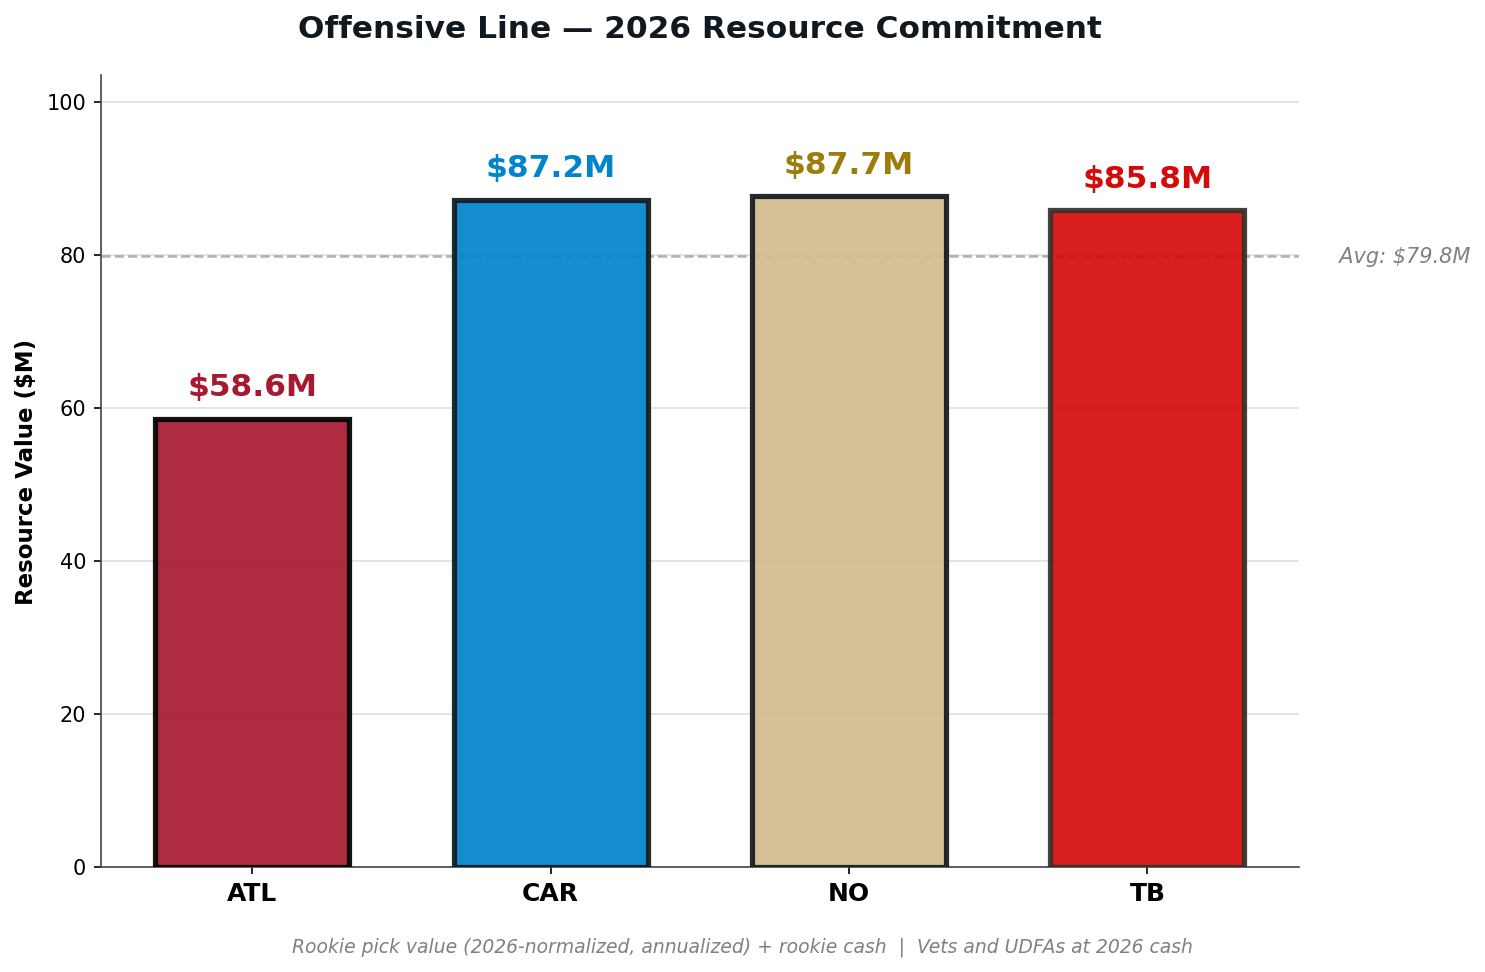
Three teams clustered within a $2M band ($85.8M to $87.7M). Atlanta sits $27M below the lowest of the three.
Like the NFC North, three NFC South teams are clearly putting real assets to this group. New Orleans pairs David Edwards’s new contract, with $21.3M in upfront cash with Erik McCoy ($10.5M), Cesar Ruiz ($9.5M), and Kelvin Banks Jr.’s pick value. Carolina runs out Ikem Ekwonu, Robert Hunt, Damien Lewis, Taylor Moton, and now Monroe Freeling’s round-one pick value. Tampa Bay has Tristan Wirfs ($26M) and Luke Goedeke ($22M) at the tackles plus a modest deal for Ben Bredeson. They have strong resources in their rookie contract players, having spent a first-round pick on Graham Barton and second-round pick on Cody Mauch to shore up the interior.
Atlanta’s $58.6M is the lowest OL spend across all eight teams tracked. Jake Matthews and Chris Lindstrom at $16M apiece anchor the unit. Matthew Bergeron supplies rookie capital. Jawaan Taylor takes the right tackle slot on a rather cheap veteran deal to replace the retiring Kaleb McGary. The swap brought the unit’s total down, but not enough that it took them out of the divisional cluster. The depth and middle of the unit are veteran-min. Atlanta has paid for two starters on the offensive line and filled the rest on the cheap.
That $27M gap to the next-lowest OL spend is the largest position-group divergence in the division.
Defensive Line
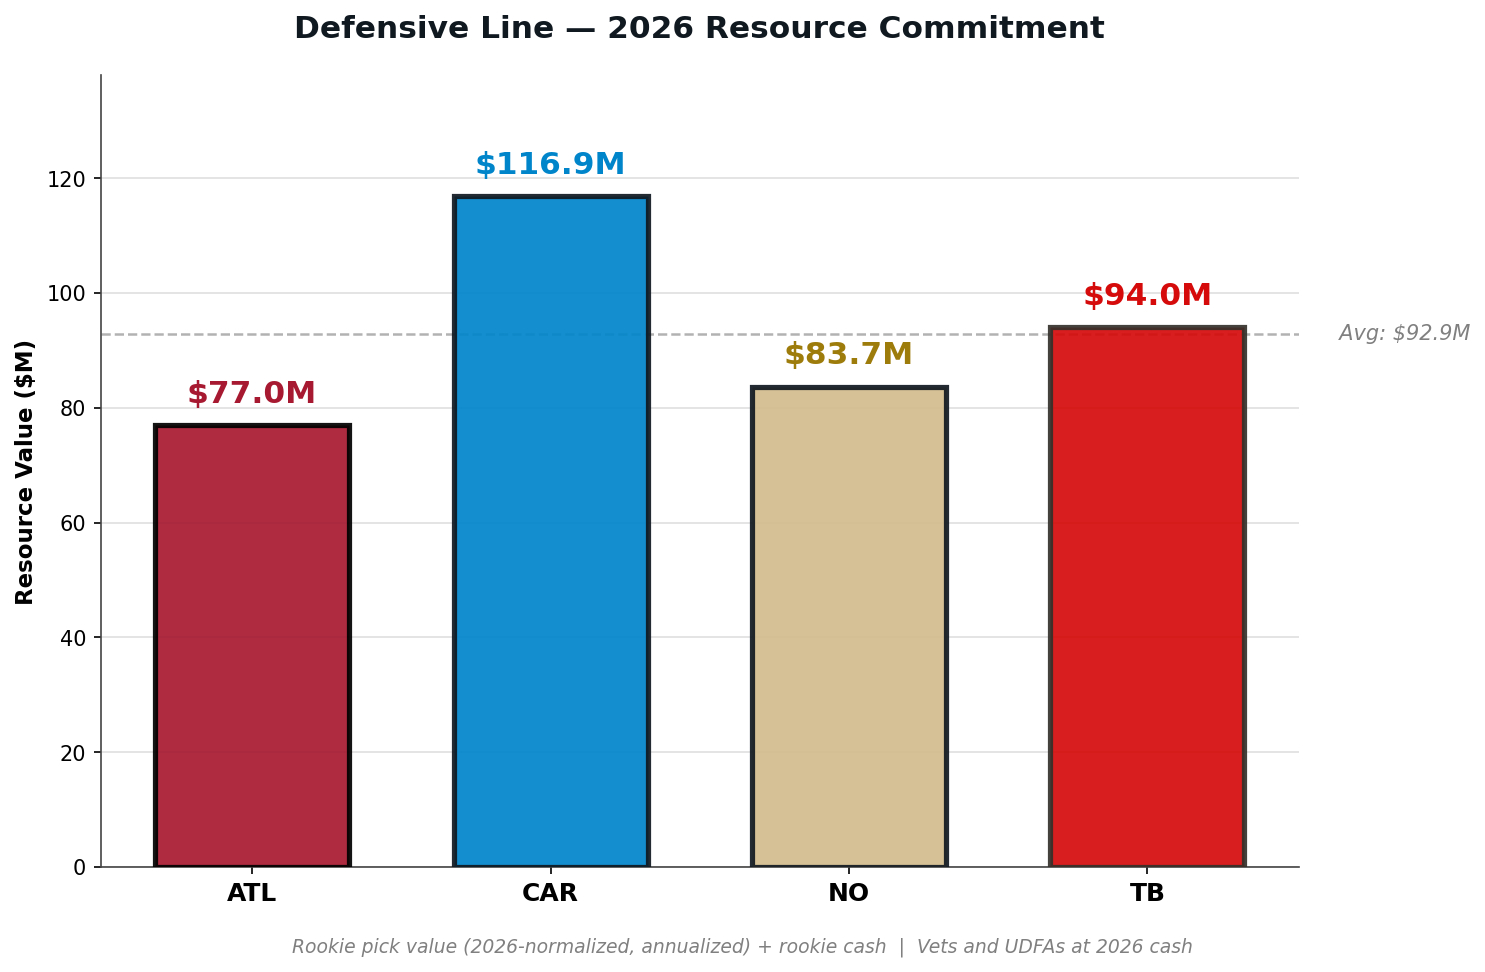
Defensive line is the largest single-position investment for every team in the division. The spread at the top is dramatic.
Carolina commits $116.9M to defensive line, the second-highest figure across all eight teams tracked. Only Green Bay’s $122M is larger. Jaelan Phillips’s $36.2M is the largest single defensive line cash payment in the division. Derrick Brown ($19.5M), Tershawn Wharton ($14M), Patrick Jones II ($6.5M), and Bobby Brown III ($6.2M) round out the vet contracts. Then add Lee Hunter, Nic Scourton, and Princely Umanmielen on rookie deals. This is the position group Carolina has built as their foundation. Considering the price paid and the product acquired, that foundation may be sitting on quicksand.
"Considering the price paid and the product acquired, that foundation may be sitting on quicksand."
Two teams across two divisions are now stacking DL above $115M. That suggests a real construction trend, not noise.
Tampa Bay ($94M) builds it through Vita Vea ($18M) and A’Shawn Robinson ($10M) on the vet side with Calijah Kancey and Rueben Bain Jr. providing substantial draft pick value. A balanced rotation rather than a single max contract.
New Orleans ($83.7M) anchors with Granderson ($12.75M) and Chase Young ($14.83M) as the EDGE pair, plus Godchaux and Bresee on the interior. A solid rotation but no superstar contract.
Atlanta ($77M) is the lightest in the division at the largest position group, and the lightest across all eight tracked. Notably, the top of their EDGE rotation runs through rookie deals. Jalon Walker ($16.94M annualized) and James Pearce Jr. ($13.8M) are a pair of first-round rookie EDGE’s who, on the cash side, total just $3.4M. The cost-controlled top of Atlanta’s pass rush could be an incredible surplus value if they hit on a couple of those picks.
Linebacker
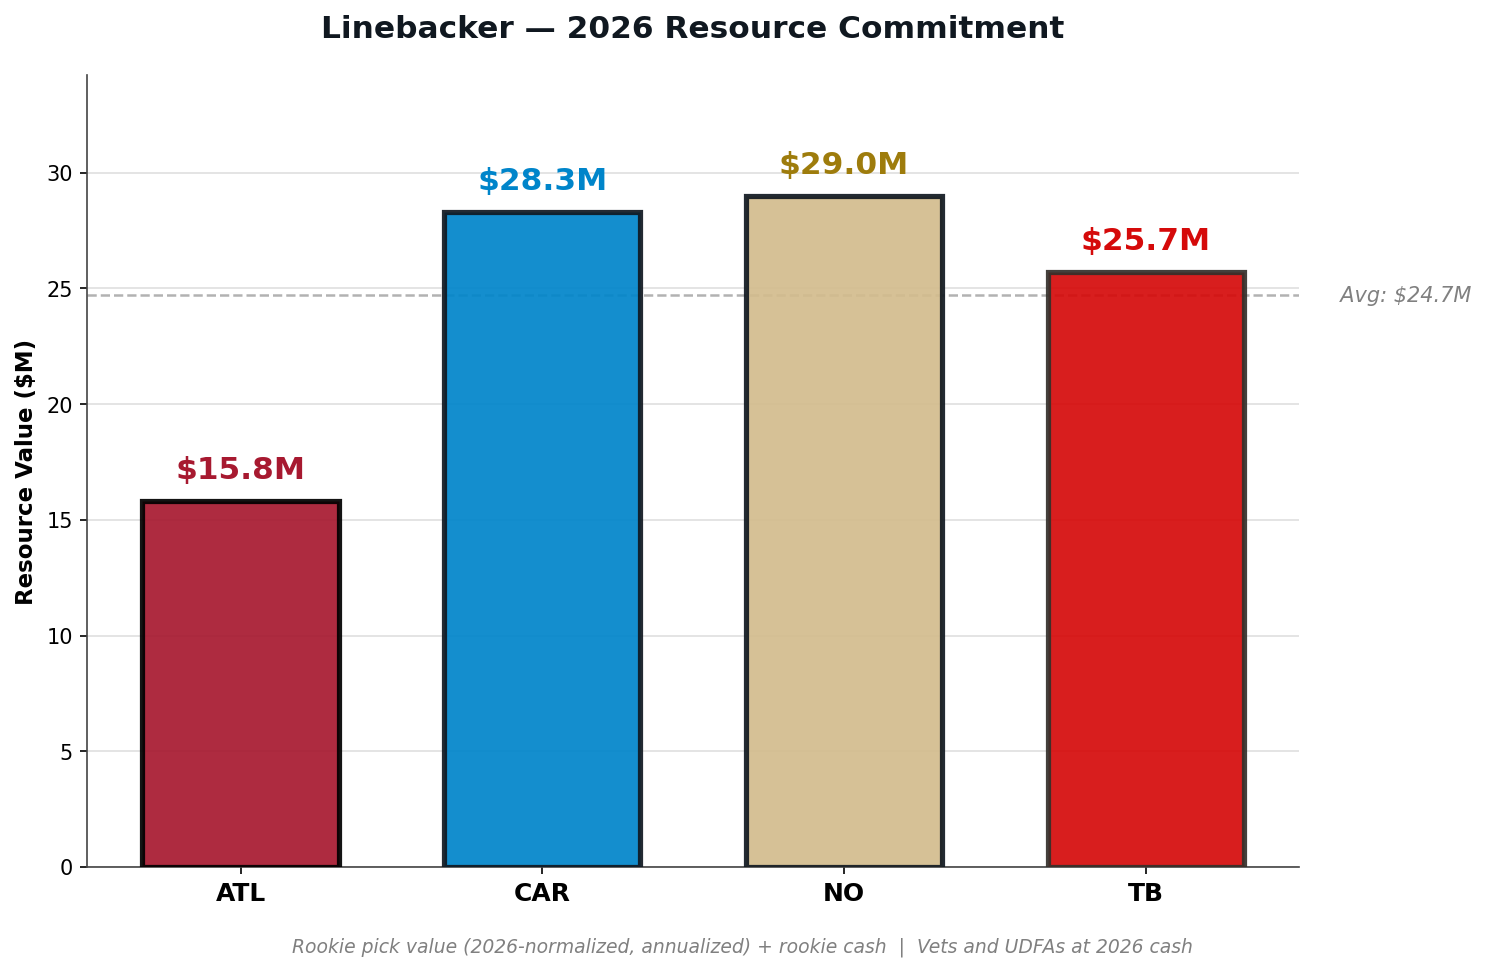
Three teams clustered between $25.7M and $29M. Atlanta sits at $15.8M, $9.9M below the next-lowest in the division and the lowest LB spend across all eight teams tracked.
Carolina’s $28.3M leans on Devin Lloyd’s $17M new contract plus Trevin Wallace’s round-three pick value. New Orleans’s $29M is primarily Pete Werner extension ($6.25M) plus Kaden Elliss’ new contract ($13.3M). Tampa Bay’s $25.7M runs through Alex Anzalone ($9M) and Josiah Trotter’s round-two pick value.
Atlanta is the outlier. Divine Deablo at $6M is the largest LB commitment on the roster and an incredible value. Christian Harris, Troy Andersen, and Channing Tindall sit on vet-min contracts. Kendal Daniels and Harold Perkins Jr. add late-round rookie capital. The Falcons are starting an entire LB room without anyone making real money or carrying real draft capital.
This is the most dramatic single-position divergence by one team from the average across both divisions tracked. Atlanta is spending 51% of the leaguewide average of $30.7M at the position.
Secondary
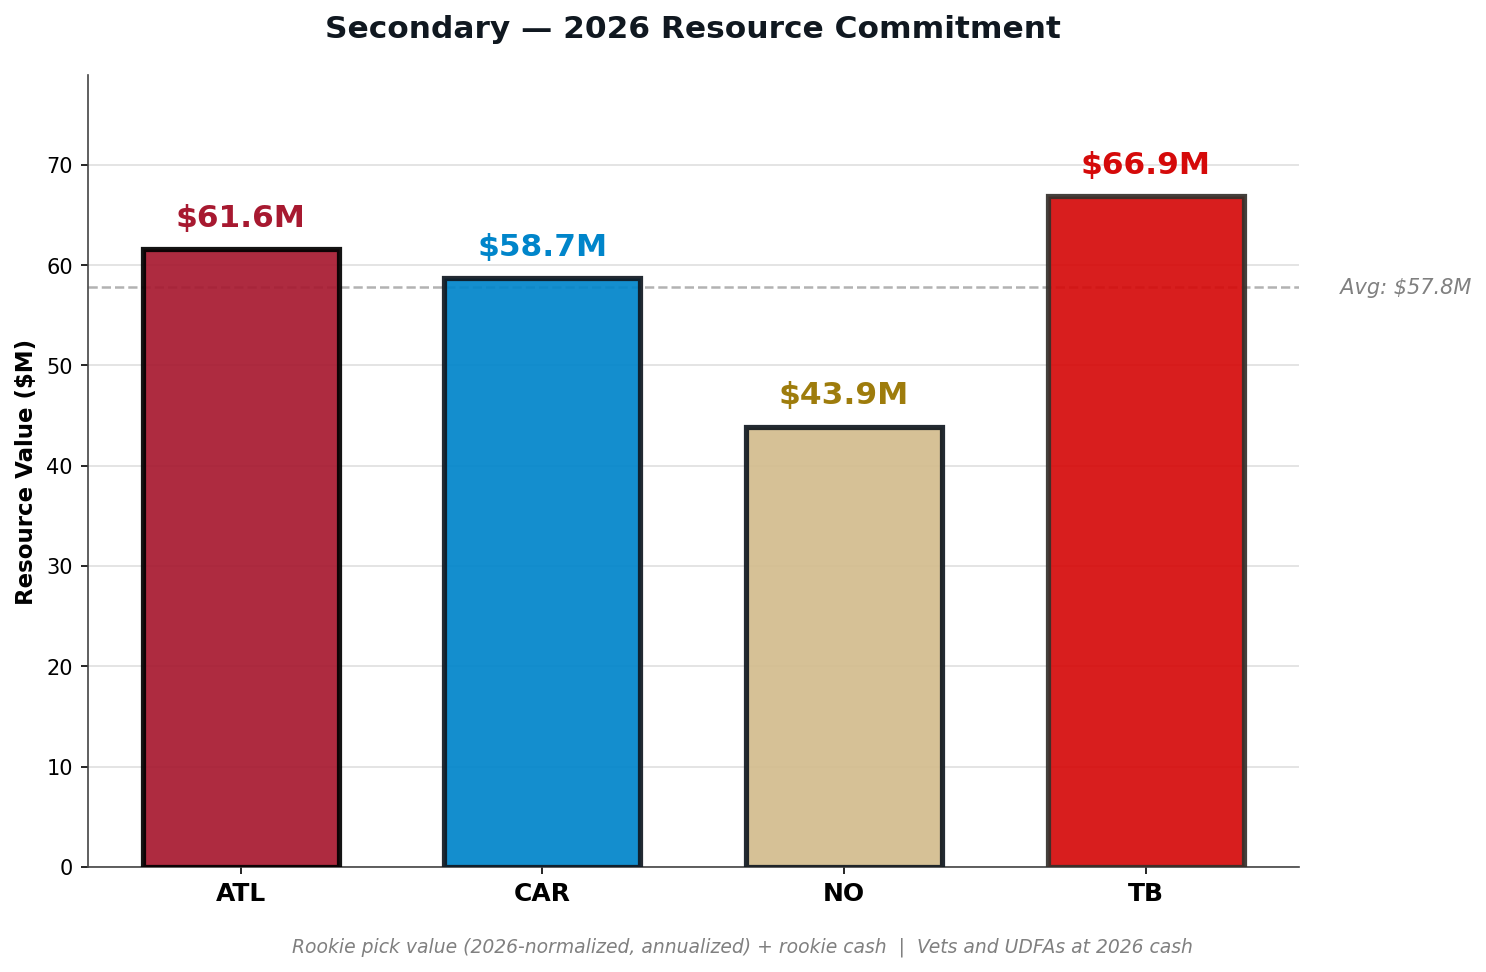
The clearest divergence in the division from the top to the bottom.
Tampa Bay ($66.9M) leads. Antoine Winfield Jr. at $19.5M is the centerpiece, with Zyon McCollum’s $14.6M as the corner anchor. With Benjamin Morrison, Jacob Parrish, and Tykee Smith on day-two rookie deals there is considerable investment diversified across both asset classes.
Atlanta ($61.6M) is closely behind. A.J. Terrell’s extension at $15M plus Jessie Bates III at $14M anchor the vet side. Then add Avieon Terrell (R2 #48 2026), Xavier Watts, Billy Bowman Jr., Clark Phillips III, and DeMarcco Hellams in rookie capital. Atlanta has stacked rookie DB picks across multiple drafts.
Carolina ($58.7M) sits third on Jaycee Horn ($18.4M) plus Tre’von Moehrig’s new $15.3M contract and Mike Jackson at $4.8M. Will Lee III, Zakee Wheatley, Lathan Ransom, and Chau Smith-Wade fill out the rookie pipeline.
New Orleans’s $43.9M is the lowest secondary spend in the division by $14.8M, and the lowest across all eight teams tracked. Justin Reid ($9.25M) and Julian Blackmon ($2.5M) are the only real vet commitments. The rest runs through Kool-Aid McKinstry, Quincy Riley, Jonas Sanker, Jordan Howden, and T.J. Hall on rookie deals. The Saints are running a rookie-heavy secondary.
Special Teams
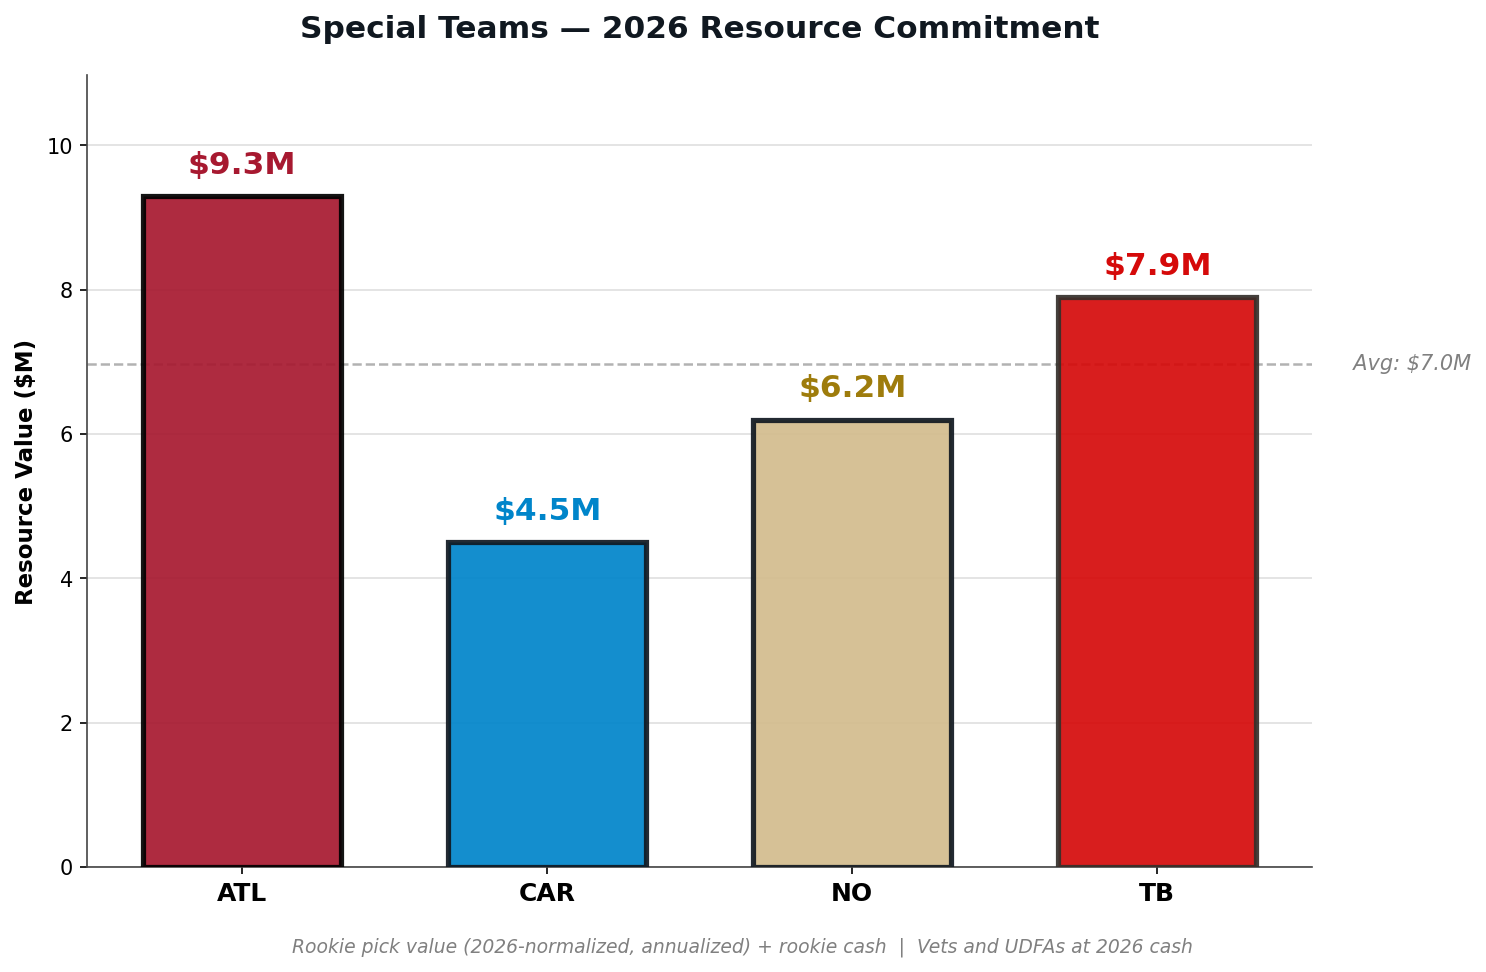
Atlanta tops the division at $9.3M, second across all eight teams behind Chicago’s $10M. Unlike Chicago’s Tory Taylor punter outlier from last week, this is mostly Nick Folk’s kicker contract ($4.5M) plus Jake Bailey ($3.6M) plus a low-cost long snapper. Carolina at $4.5M is the lowest in the division. Ryan Fitzgerald on a UDFA-rookie contract plus Sam Martin punting plus J.J. Jansen at long snapper. The smallest absolute spread of any position group, but a real $4.8M gap between the high and low.
A Quick Macro Look
Now a quick look at two divisions’ team-by-team asset building.
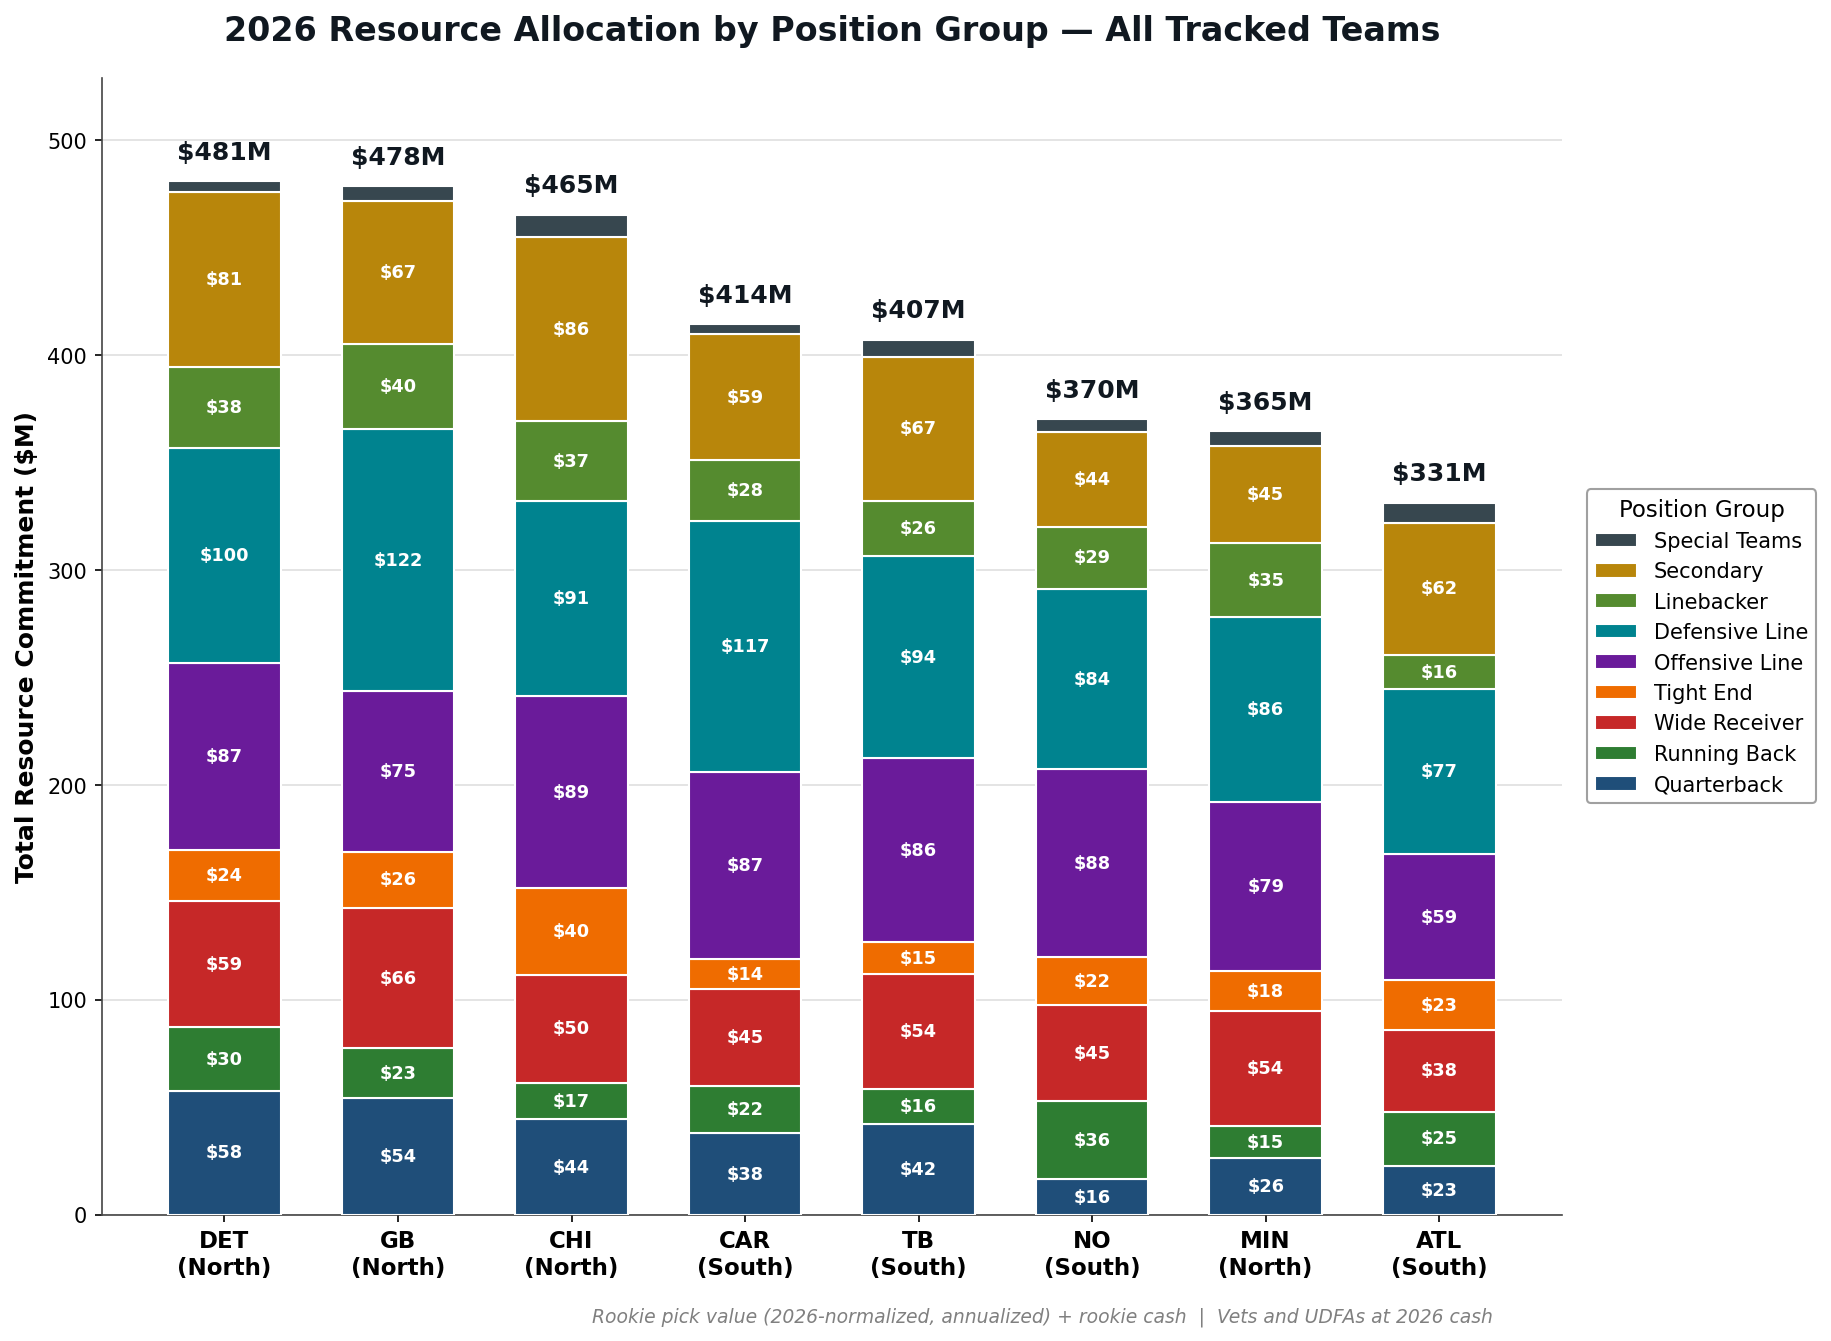
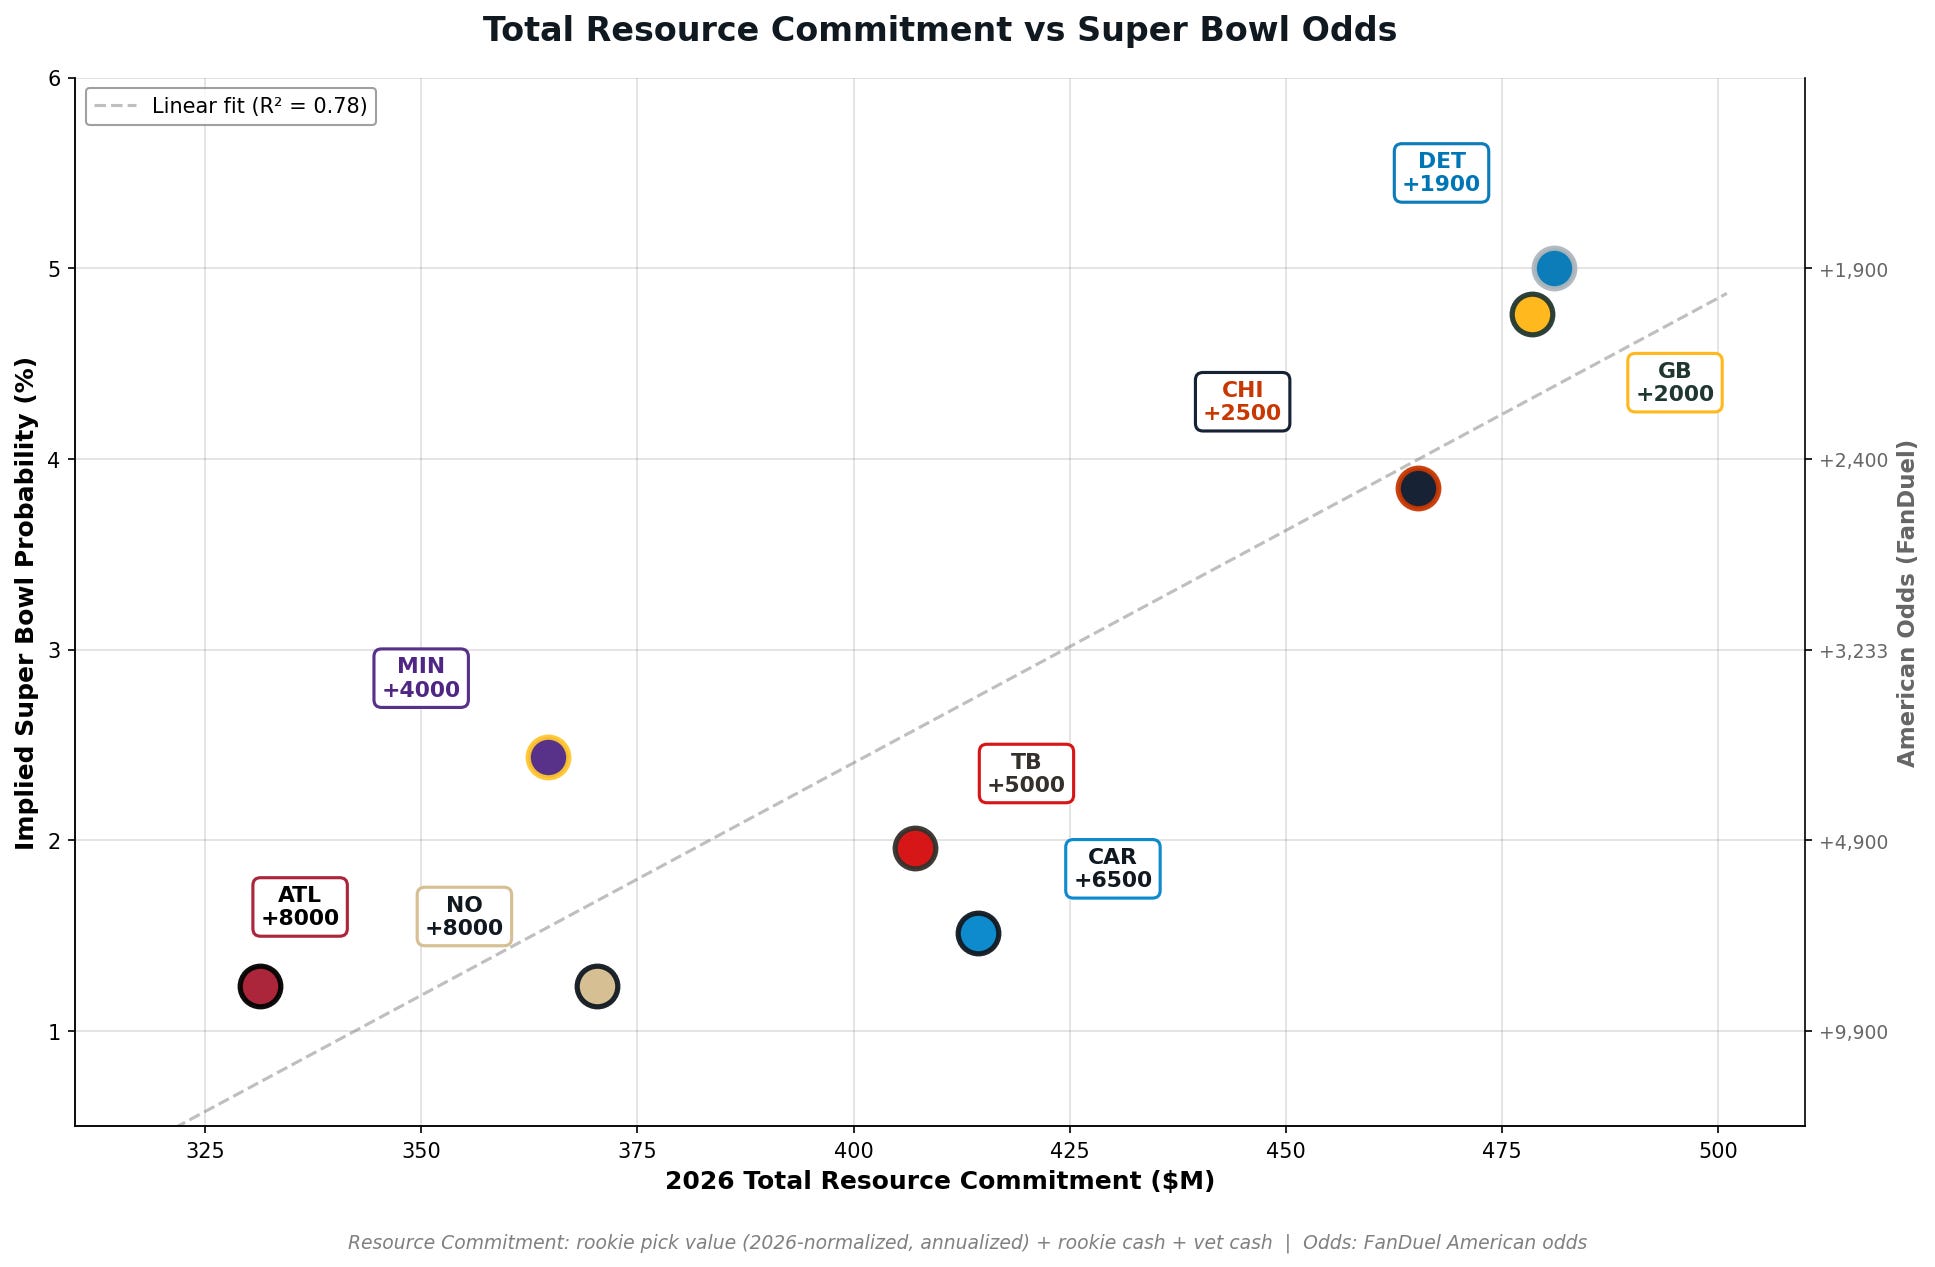
A $150 million spread between the top and bottom team is massive, especially in a system designed to prevent exactly that. The salary cap was built to keep teams from buying championships. Total resource commitment still explains roughly 78% of the variance in Super Bowl odds across these eight teams.
The salary cap is supposed to flatten spending in any given year, but it doesn't flatten the accumulation of assets that win games. Void years, cap proration and clever draft strategies have given smart teams who are willing to commit the real system commodities (cash and draft picks) a tangible leg up. That's the gap to watch as the rest of the league fills in over the next seven weeks.
“The salary cap is supposed to flatten spending in any given year, but it doesn’t flatten the accumulation of assets that win games.”
Methodology Note
The 53-man rosters are projected from Ourlads depth charts as of May 14, 2026. Rookie pick values are from my proprietary 2026-normalized draft pick value model, annualized over four years. Cash figures are from Spotrac’s 2026 cash tables. UDFAs and players on cap-minimum vet deals are valued at their actual 2026 cash. Players who have signed extensions beyond their original rookie deal are treated as veterans (using cash), not as rookies (using pick value), regardless of whether they were drafted by their current team.
Position groups: QB, RB, WR, TE, OL, DL (IDL + EDGE combined), LB, SEC (CB + S combined), and ST (K, P, LS).
No positional adjustments are applied to pick values. A running back taken at #3 carries the same resource value as a quarterback taken at #3 in this framework. This is a deliberate choice consistent with the goal of measuring resource commitment, not expected return.
What’s Next?
Next week I’ll dive into the NFC East, NFC West, AFC North, South, East and West. At the end of the series, I’ll then look for anomalies within the league-wide context in a final look at the league as a whole. If it’s anything like this first divisional look there are peculiar and fascinating team building phenomena to surface in every division. And perhaps a pattern will emerge among perennial playoff contenders.